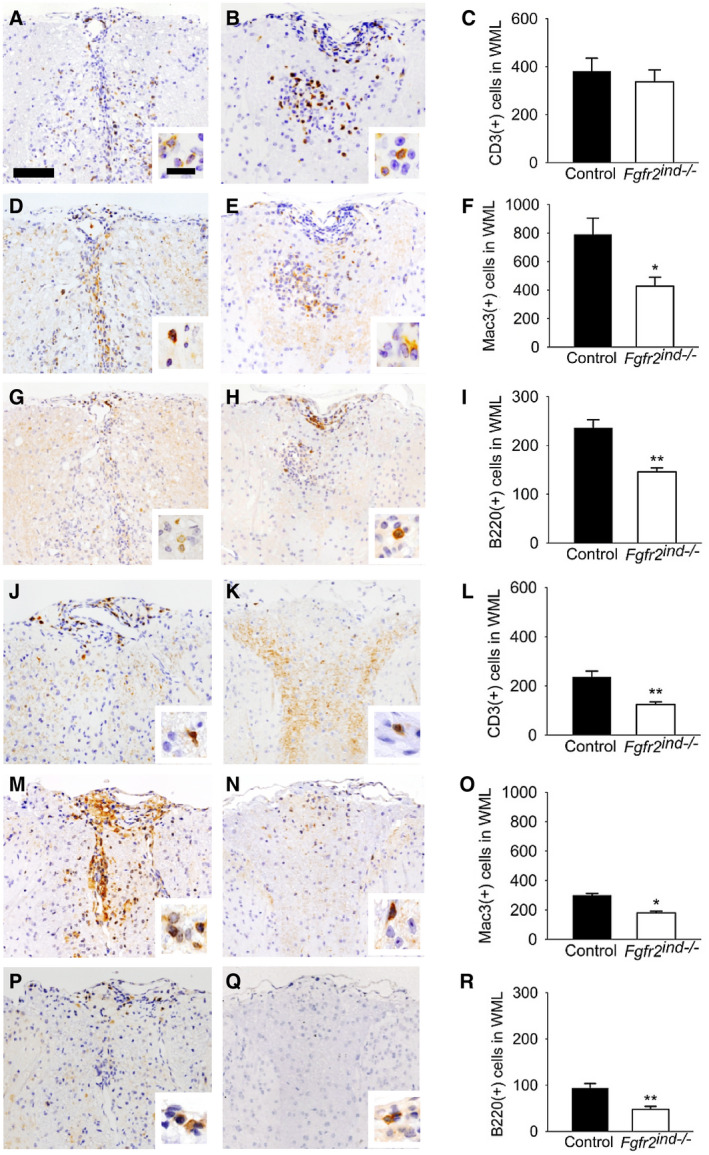
FIGURE 4.

Inflammatory cells in the acute and chronic phase of EAE. Representative images of spinal cord white matter lesions are shown in acute phase for controls (A, D, G) and Fgfr2ind −/− mice (B, E, H). The number of CD3(+) T lymphocytes was not different between Fgfr2ind −/− mice and controls (A–C). The number of Mac3(+) cells (D–F) and B220(+) B lymphocytes (G–I) was significantly less in Fgfr2ind −/− mice. Representative images of spinal cord white matter lesions in the chronic phase of EAE are shown for controls (J, M, P) and Fgfr2ind −/− mice (K, N, Q). The number of CD3(+) T lymphocytes (J–L), Mac3(+) macrophages/microglia (M–O) and B220(+) B lymphocytes (P–R) was significantly less in Fgfr2ind −/− mice. n = 4 in acute phase and n = 5 in chronic phase, data are presented as mean ±SEM. *p < 0.05; **p < 0.005. Bar: 100 µm, 20 µm (insert).
