FIGURE 5.

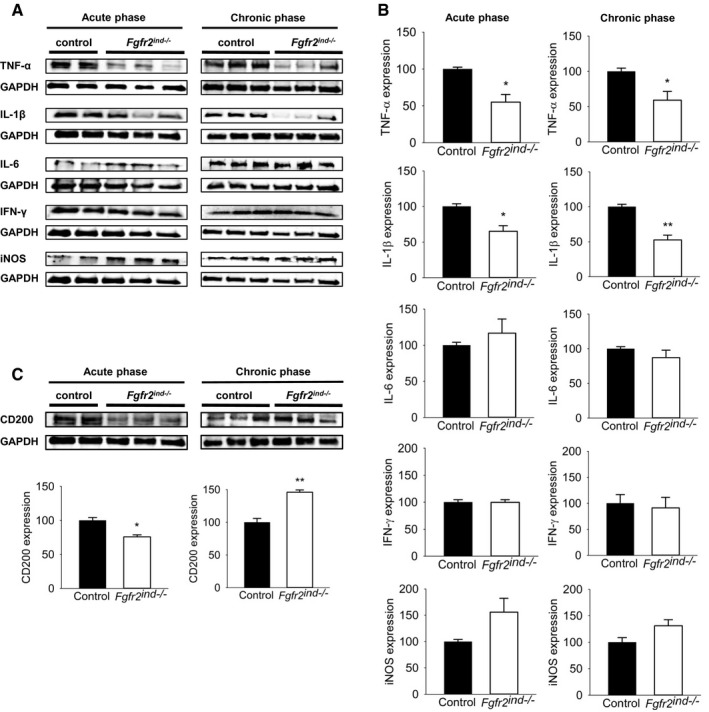
Expression of inflammatory cytokines in the spinal cord of the acute and chronic phase of EAE. Representative western blot images of inflammatory cytokines and quantification are shown (A and B). Key inflammatory cytokine TNF‐α and IL‐1β expression was less in the acute and chronic phase. IL‐6, IFN‐γ and iNOS expression was not regulated in Fgfr2ind −/−mice. (C) Representative western blot and quantification of CD200 expression are shown. In the acute phase of EAE, CD200 expression was reduced in Fgfr2ind −/− mice compared to controls, whereas in the chronic phase CD200 expression was upregulated in the Fgfr2ind −/− mice. n = 2–3 in acute phase and n = 3 in chronic phase, data are presented as mean ±SEM. *p < 0.05; **p < 0.005.
