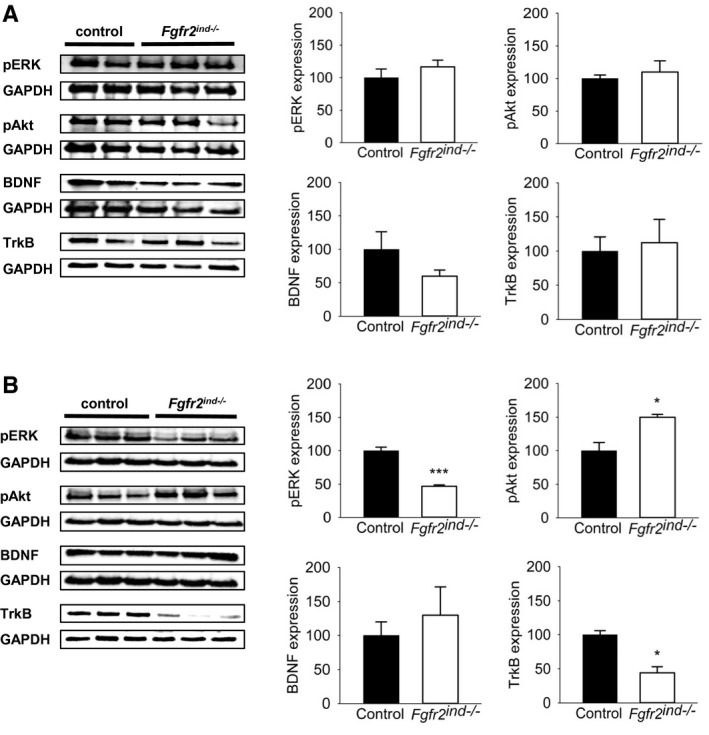
FIGURE 8.

FGFR2 downstream and associated signalling in the acute and chronic phase of EAE. Representative western blots and quantification are shown for the acute and chronic phase of EAE. (A) In the acute phase of EAE no differences in ERK and Akt phosphorylation and expression of BDNF and TrkB were seen between Fgfr2ind −/− mice and controls. (B) In the chronic phase less expression of ERK1/2 phosphorylation and upregulated Akt phosphorylation was found in Fgfr2ind −/− mice. BDNF expression was not regulated in the chronic phase of EAE, whereas TrkB expression was downregulated in Fgfr2ind −/− mice. n = 2–3 in acute phase and n = 3 in chronic phase, data are presented as mean ±SEM. *p < 0.05; ***p < 0.001.
