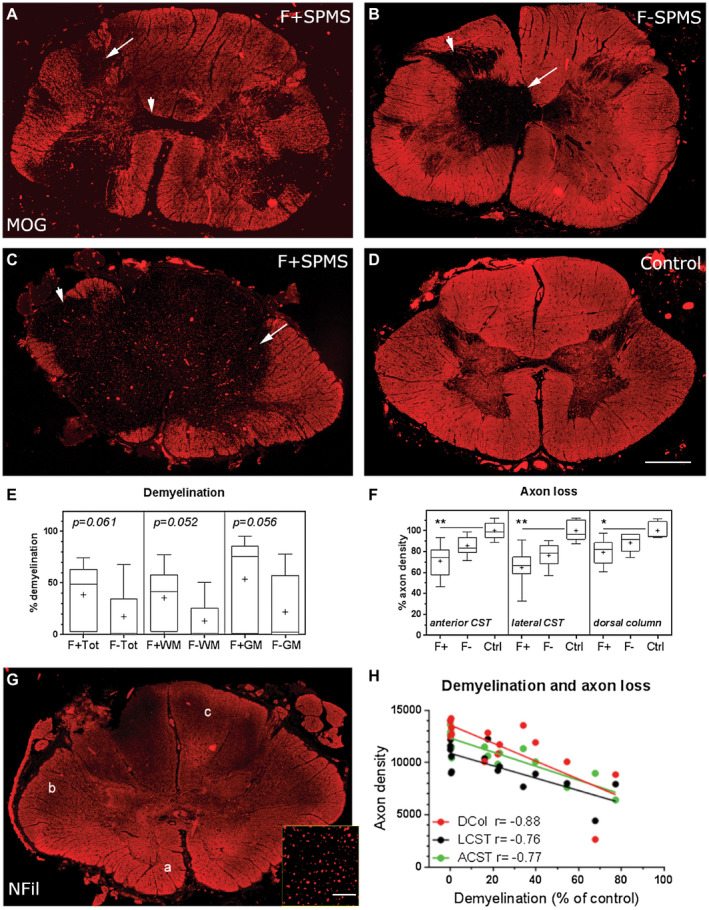
Figure 4.

Demyelination and axon loss in the SPMS cord. Anti‐MOG immunostaining revealed the variable extent of demyelination in the F+ and F− SPMS spinal cord. Multiple discrete white and grey matter lesions or extensive confluent demyelination was seen in F+ SPMS, whereas lesions tended to be smaller in the F− SPMS cord (A–C; arrows). MOG+ myelin in a control case for comparison (D). The percentage of total (Tot), white matter (WM) and grey matter (GM) demyelination showed a trend to being greater in the F+ SPMS cohort in comparison to the F− SPMS cases (E). Axon density was determined by quantifying the number of neurofilament H+ (NFil) structures in the anterior (a) and lateral (b) corticospinal tracts (CST) and the dorsal column (c; F, G). Axon density relative to control counts were compared for each tract across the three sampled levels (cervical, thoracic and lumber cord) and expressed as percent axon loss. Axon density (%) was reduced in comparison to control axon counts in F+ SPMS cases at all sampled levels of the cord. Total axon count correlated with the relative area of white matter demyelination in F+ SPMS (P < 0.002 for each comparison; H). Box‐and‐whiskers plot showing the mean (+), median (line), interquartile range (box) and 5‐95 percentiles (whiskers) for each group. Differences between groups were tested by (E) the non‐parametric Mann‐Whitney test or (F) Kruskal–Wallis and Dunn's multiple comparison posttest. *P < 0.05, **P < 0.01. Correlation analysis by Spearman comparison. Scale bars (A–D, G) = 1 mm, inset 40 µm. Ctrl, control; F+, lymphoid‐like structure positive SPMS; F−, lymphoid‐like structure negative SPMS.
