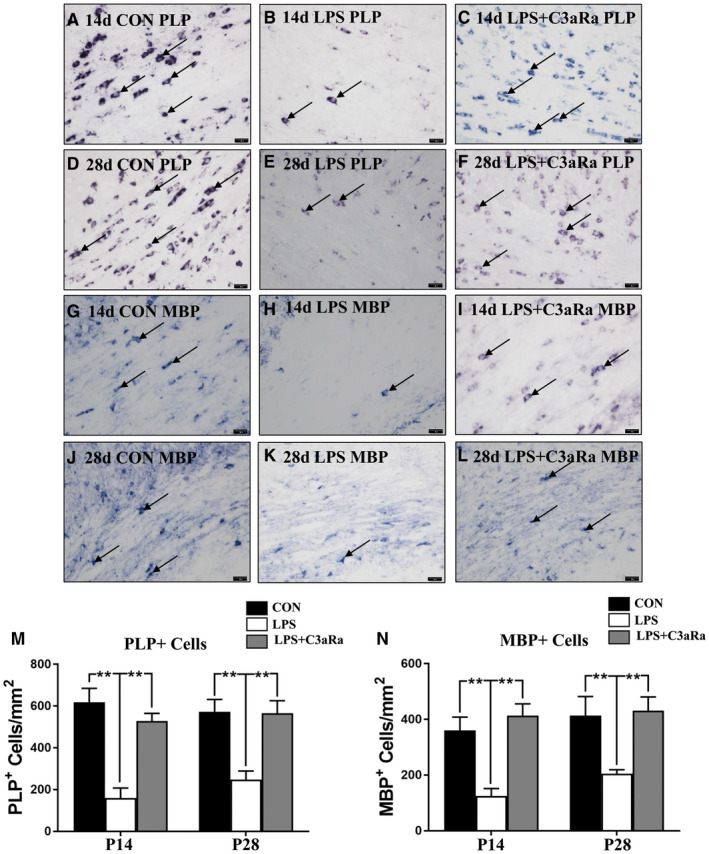
Figure 2.

C3aRa administration increase the number of PLP+ and MBP+ oligodendrocytes in the PWM after LPS injection by in situ hybridization. (A–L) In situ hybridization shows the number of PLP+ and MBP+ oligodendrocytes in the PWM at 14 and 28 days after LPS injection, LPS + C3aRa administration and the matching control at the magnification of ×40. Note C3aRa administration reverses the decreased number of PLP+ and MBP+ oligodendrocytes in the PWM induced by LPS exposure at 14 and 28 days (n = 5). Bar graph (M, N) shows the number of PLP+ and MBP+ oligodendrocytes in the PWM at 14 and 28 days using in situ hybridization (n = 5). For statistical analysis, two‐way ANOVA with Tukey's post hoc test was used for M and N and presented as the mean ± standard error of measurement (SEM). Scale bars: 20 μm. *P < 0.05, **P < 0.01.
