Figure 3.

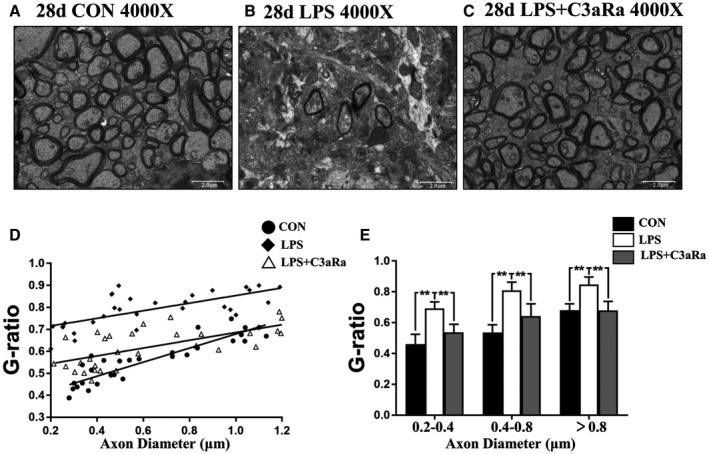
C3aRa administration prevents hypomyelination in the PWM after LPS injection by electron microscope. Electron microscopic images of PWM at the magnification of ×4000. (A–C) show myelinated axonal profiles in transverse section in the PWM at 28 days after the LPS injection (B), LPS + C3aRa administration (C) and their matching controls (A) (n = 5). Scatter plots of g‐ratio against axon diameter in the PWM at 28 days after the LPS injection, LPS + C3aRa administration and corresponding control are shown in bar graph D (n = 30). E is bar graph showing increased g‐ratio of myelinated axons of different diameters in the PWM at 28 days after the LPS injection, LPS + C3aRa administration and corresponding control (n = 10). For statistical analysis, two‐way ANOVA with Tukey's post hoc test was used for E and presented as the mean ± standard error of measurement (SEM). Scale bars: 2 μm. *P < 0.05, **P < 0.01.
