
Figure 4.
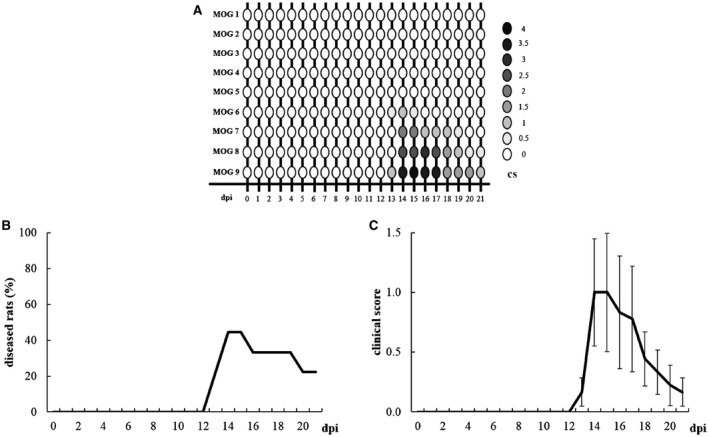
A. Graphic representation of individual clinical profile in EAE rats from 0 to 21 dpi. B. Kaplan–Meier curve representing EAE rats (n = 9) with clinical symptoms. C. Clinical score of EAE rats (n = 9) from 0 to 21 dpi. Data are expressed as mean ± SEM.