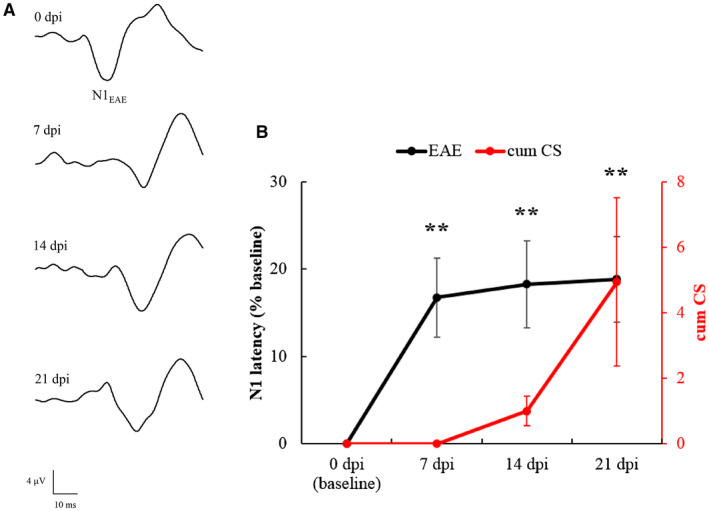
Figure 5.

A. Representative VEP traces recorded from an EAE rat at different time points. B. N1 latency of EAE eyes (n = 18, black line) measured at different time points and normalized as % of baseline. Asterisks indicate the significance level of VEP latency in EAE eyes compared to their baseline. (**: P < 0.01). The red line indicates the cumulative clinical score (=progressive sum of the clinical scores of EAE rats at each time point) in EAE rats from 0 to 21 dpi. Data are expressed as mean ± SEM.
