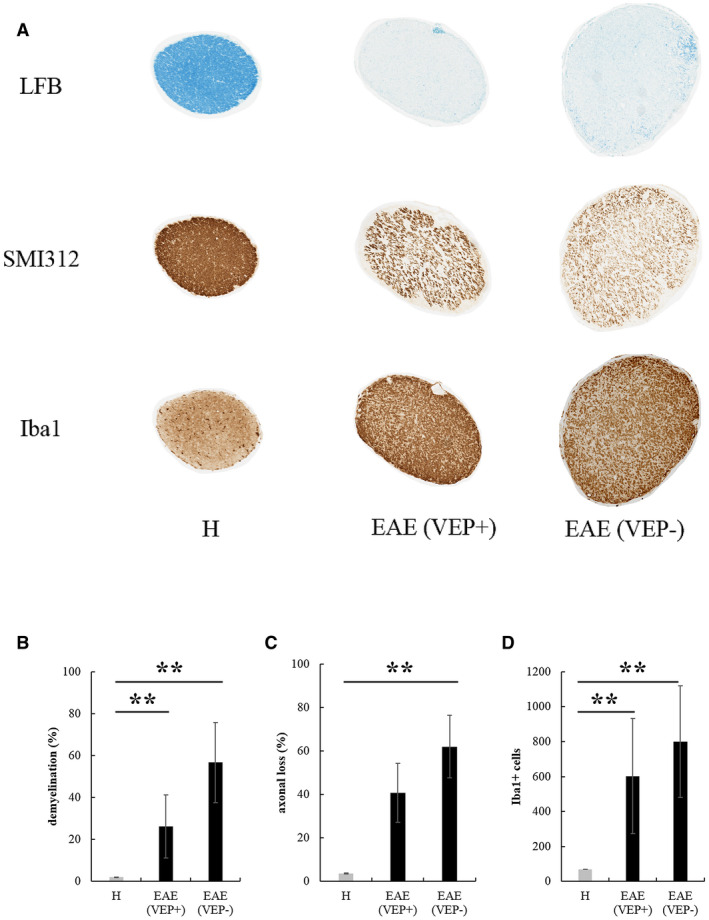
Figure 9.

A. Transversal ON sections stained to detect demyelination (LFB), axonal loss (SMI312) and activated microglia/macrophages (Iba1) in H and EAE ONs at 56 dpi (magnification: 10×). Quantification of demyelination (B), axonal loss (C) and Iba1+ cells (D) in ONs from H eyes (n = 6), EAE eyes with recorded VEPs (VEP+, n = 7) and eyes with absent VEPs (VEP‐, n = 5) (**: P < 0.01). Data are expressed as mean ± SEM.
