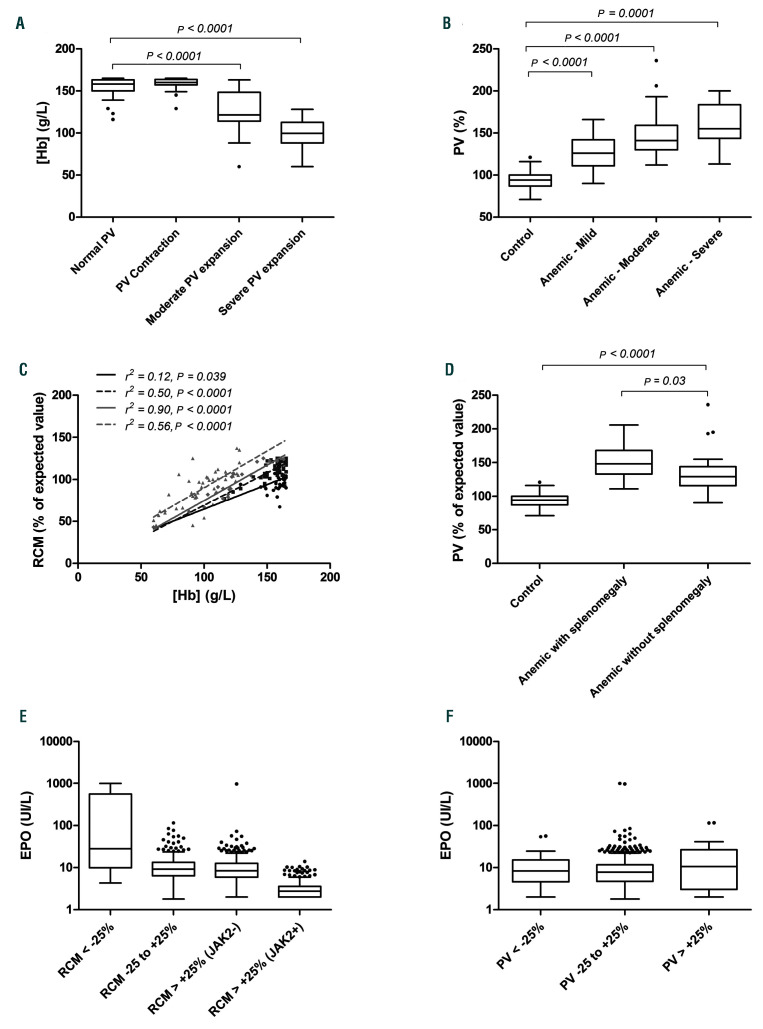
Figure 2.
Correlations between hemoglobin concentration [Hb], plasma volume (PV), red cell mass (RCM), splenomegaly, and erythropoietin (EPO) concentrations. (A) [Hb] (g/L) according to PV groups of patients. (B) PV (in % of expected theoretical value) in the anemic groups of patients (World Health Organization definition). (C) Correlations of RCM (in % of expected theoretical value) and [Hb] in different PV groups: black points and continuous line represents a group of PV contraction patients, dark gray squares and discontinued line represent a group of normal PV patients, light gray diamonds and continuous line represent a group of moderate PV expansion patients, light gray triangles and discontinued line represent a group of severe PV expansion patients. (D) PV in anemic patients according to spleen enlargement. (E) EPO concentrations according to RCM groups or (F) PV groups (in % of expected theoretical value).

