
Figure 2.
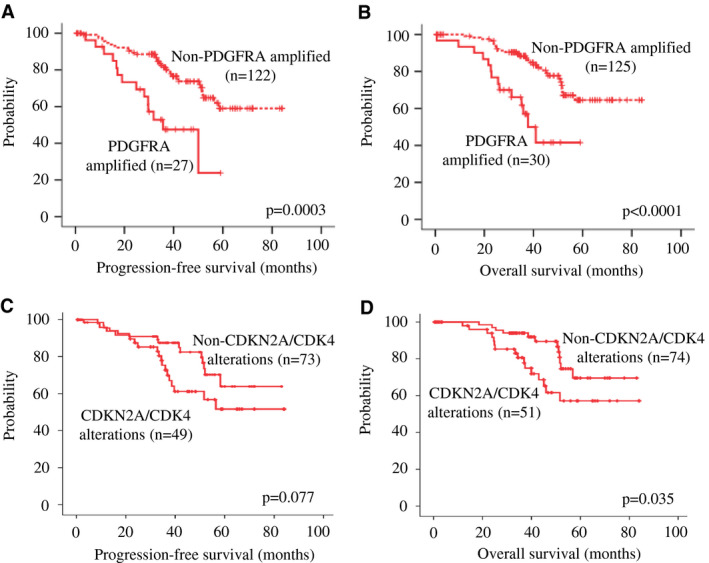
Kaplan–Meier survival curves of PDGFRA amplification, CDKN2A deletion and CDK4 amplification. Alteration in PDGFRA (a member in the RTK‐PI3K‐mTOR pathway) was associated with shorter (A) PFS (P < 0.0001) and (B) OS (P < 0.0001). Alteration in CDKN2A or CDK4 (members in the RB pathway) showed a trend toward a poorer (C) PFS (P = 0.077) and was associated with a shorter (D) OS (P = 0.035).