
Figure 4.
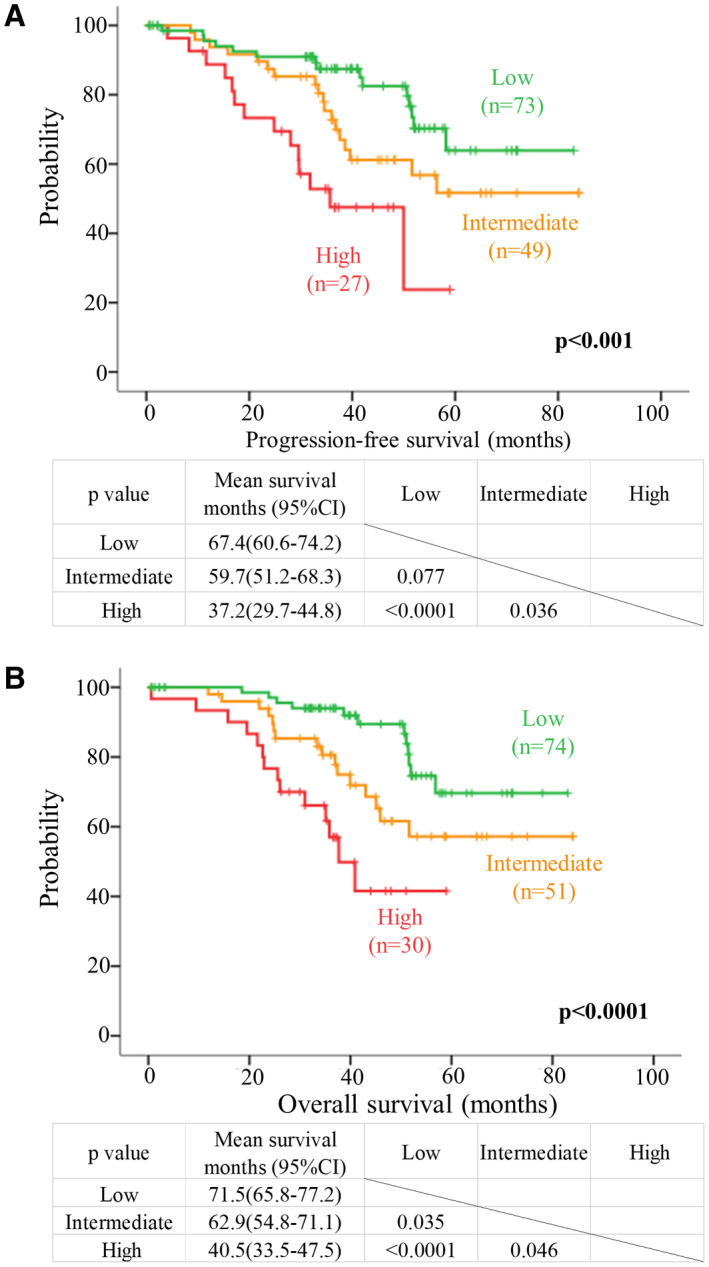
Risk stratification of IDH mutant lower grade astrocytomas based on molecular markers. Kaplan–Meier survival curves of molecular‐based risk group for (A) PFS and (B) OS. Green, orange and red lines represent survival curves for low‐, intermediate‐ and high‐risk groups respectively. Patients with PDGFRA amplification representing a change in the RTK‐PI3K‐mTOR pathway were assigned to high‐risk group. Patients with CDKN2A deletion or CDK4 amplification representing a change in the RB pathway were grouped into intermediate‐risk group. Patients without PDGFRA, CDKN2A and CDK4 aberrations were grouped into low‐risk group. These three risk groups had distinct PFS (P < 0.001) and OS (P < 0.001).