
Figure 9.
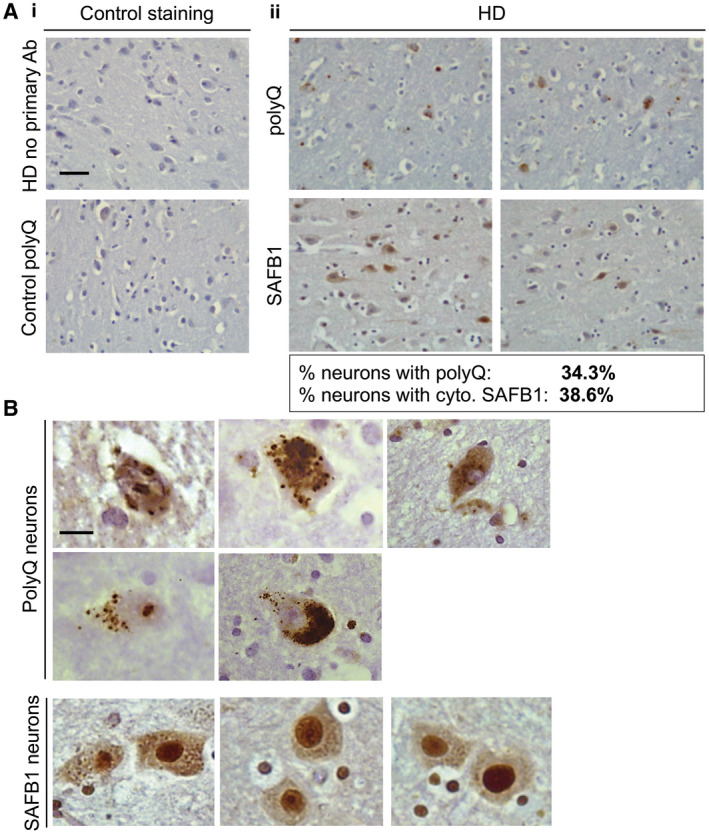
Frequency and localization of SAFB1 staining compared with polyglutamine inclusions in HD. A i. No primary antibody control staining of striatal tissue from an HD patient (upper panel). Polyglutamine immunostaining using antibody 1C2 in the striatum of a control patient shows no immunoreactivity (lower panel). ii. Representative low‐magnification images of polyglutamine and SAFB1 staining in separate, serial striatal sections of an HD patient (case 23). The percentage of neurons positive for cytoplasmic SAFB1 and for polyQ is indicated below the images. B. High magnification images show that polyQ aggregates/inclusions occur in both the nucleus and cytoplasm. SAFB1 staining is generally homogenous, with strong staining throughout the nucleus and an even distribution of staining with small puncta present throughout the cytoplasm. Scale bar in (A) is 50 µm, in (B) is 10 µm.