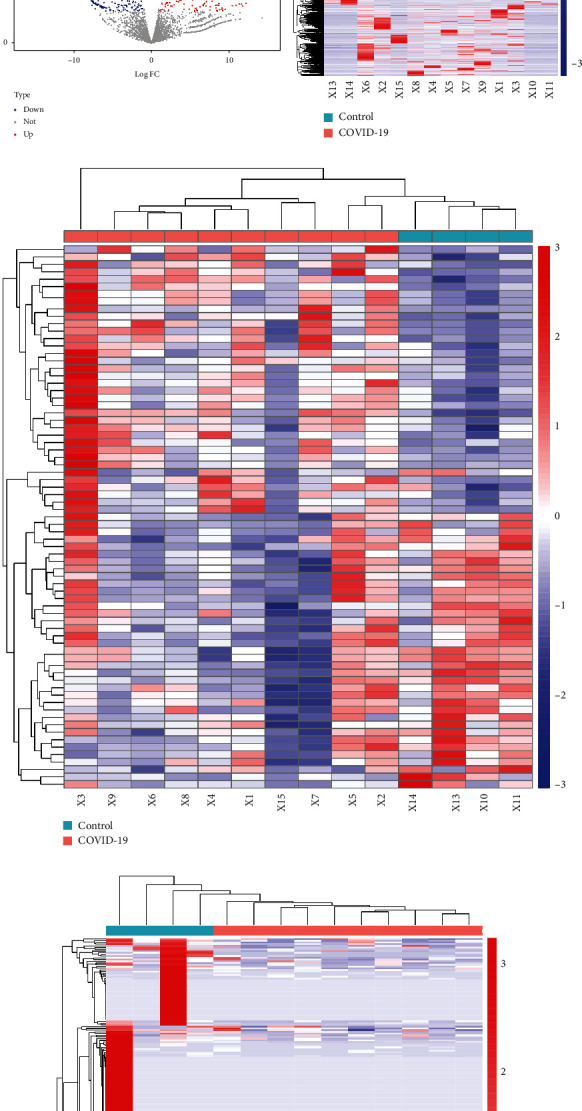
Figure 2.

Volcano plots and heatmaps of differentially expressed genes (DEGs). Volcano plots showing significantly different expressions of mRNAs (a), miRNAs (b), and lncRNAs (c) between the COVID-19 and control groups. Red points: upregulated DEGs; blue points: downregulated DEGs; gray and green points: the genes with no obvious difference in expression levels. Heatmaps of DE mRNAs (d), DE miRNAs (e), and DE lncRNAs (f). Red represents upregulation, and blue represents downregulation.
