
Fig. 13.
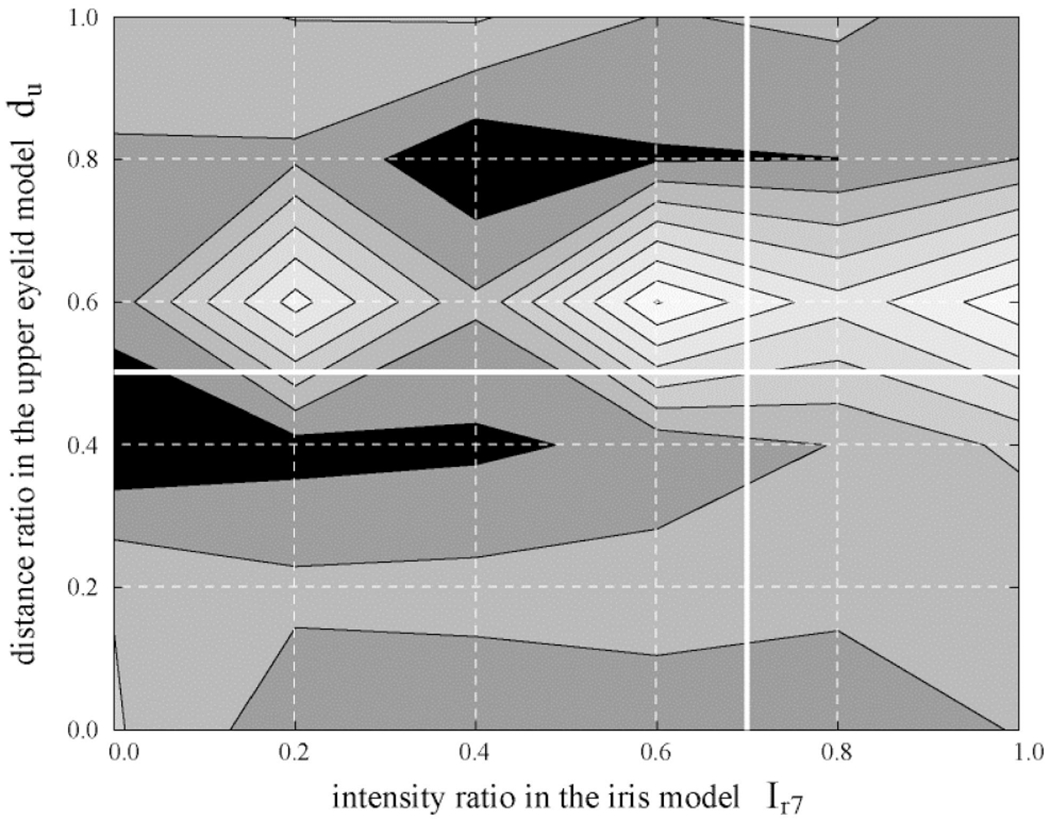
A contour plot of tracking error against an example pair of the structure parameters: the intensity ratio of the iris model Ir7 versus the distance ratio between eyelid folds du. The other parameters were left fixed. The brighter region indicates larger error. White lines are the values individualized in Fig. 12.