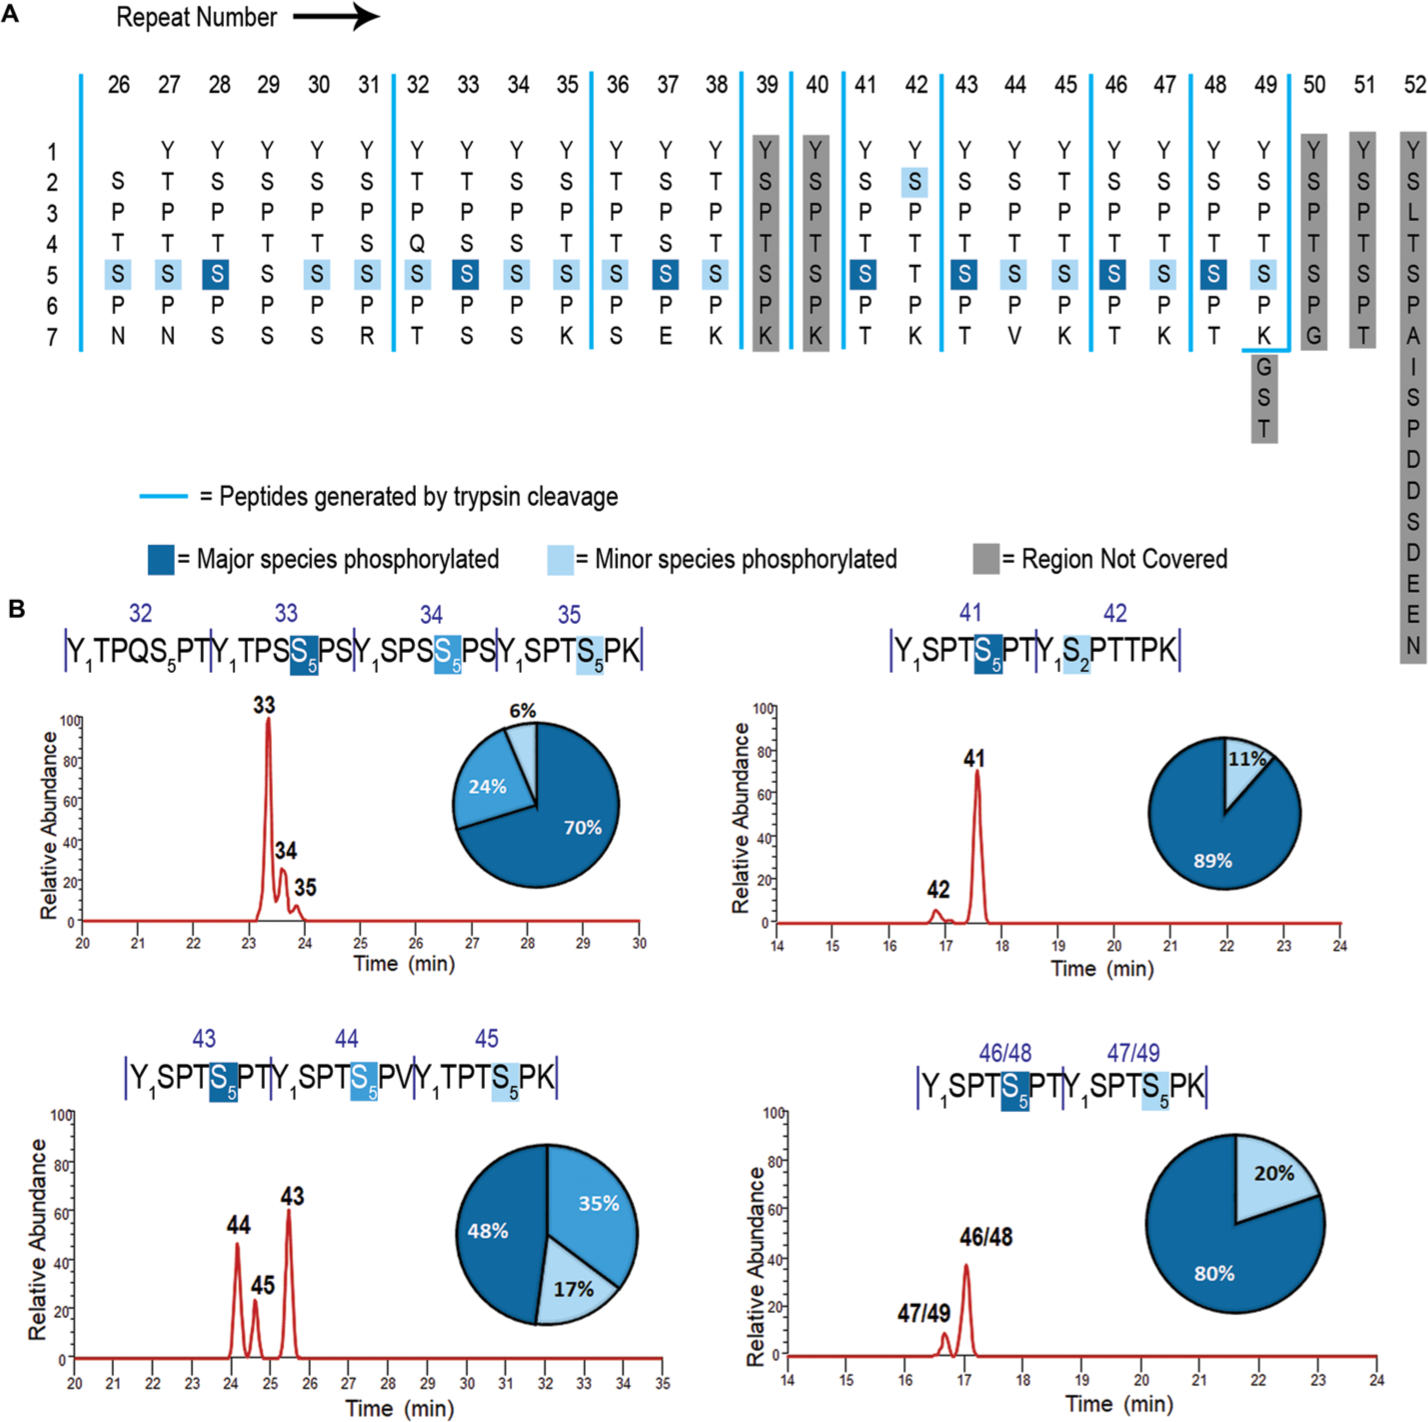
Figure 1.

Mapping the phosphorylation sites of human distal CTD treated with CDK7. (A) Human distal CTD sequence is arranged with each repeat vertically. Numbers on the vertical axis indicate residue numbers in every heptad of the CTD. Numbers on the horizontal axis indicate the repeat number of human distal CTD. Dark blue highlights major phosphorylation species. Light blue indicates minor phosphorylation species. Light gray shade shows regions not covered in mapping. Blue vertical solid line marks the boundaries of peptide fragments generated by trypsin digestion. (B) Liquid chromatography traces of each peptide showing monophosphorylated species. The numbers above each sequence and each chromatographic peak correspond to the specific repeats of the CTD sequence. Vertical dashes are used to demarcate each repeat of the CTD. The quantification for peptides is shown as a pie chart with a color-coded percentage for each peptide product. The bottom right panel shows two repeat numbers corresponding to the same sequence due to their identical fragmentation in the distal CTD map. Thus, the two diheptads would be indistinguishable from each other, and the resultant LC trace is a sum of both the diheptads.
