
Figure 2.
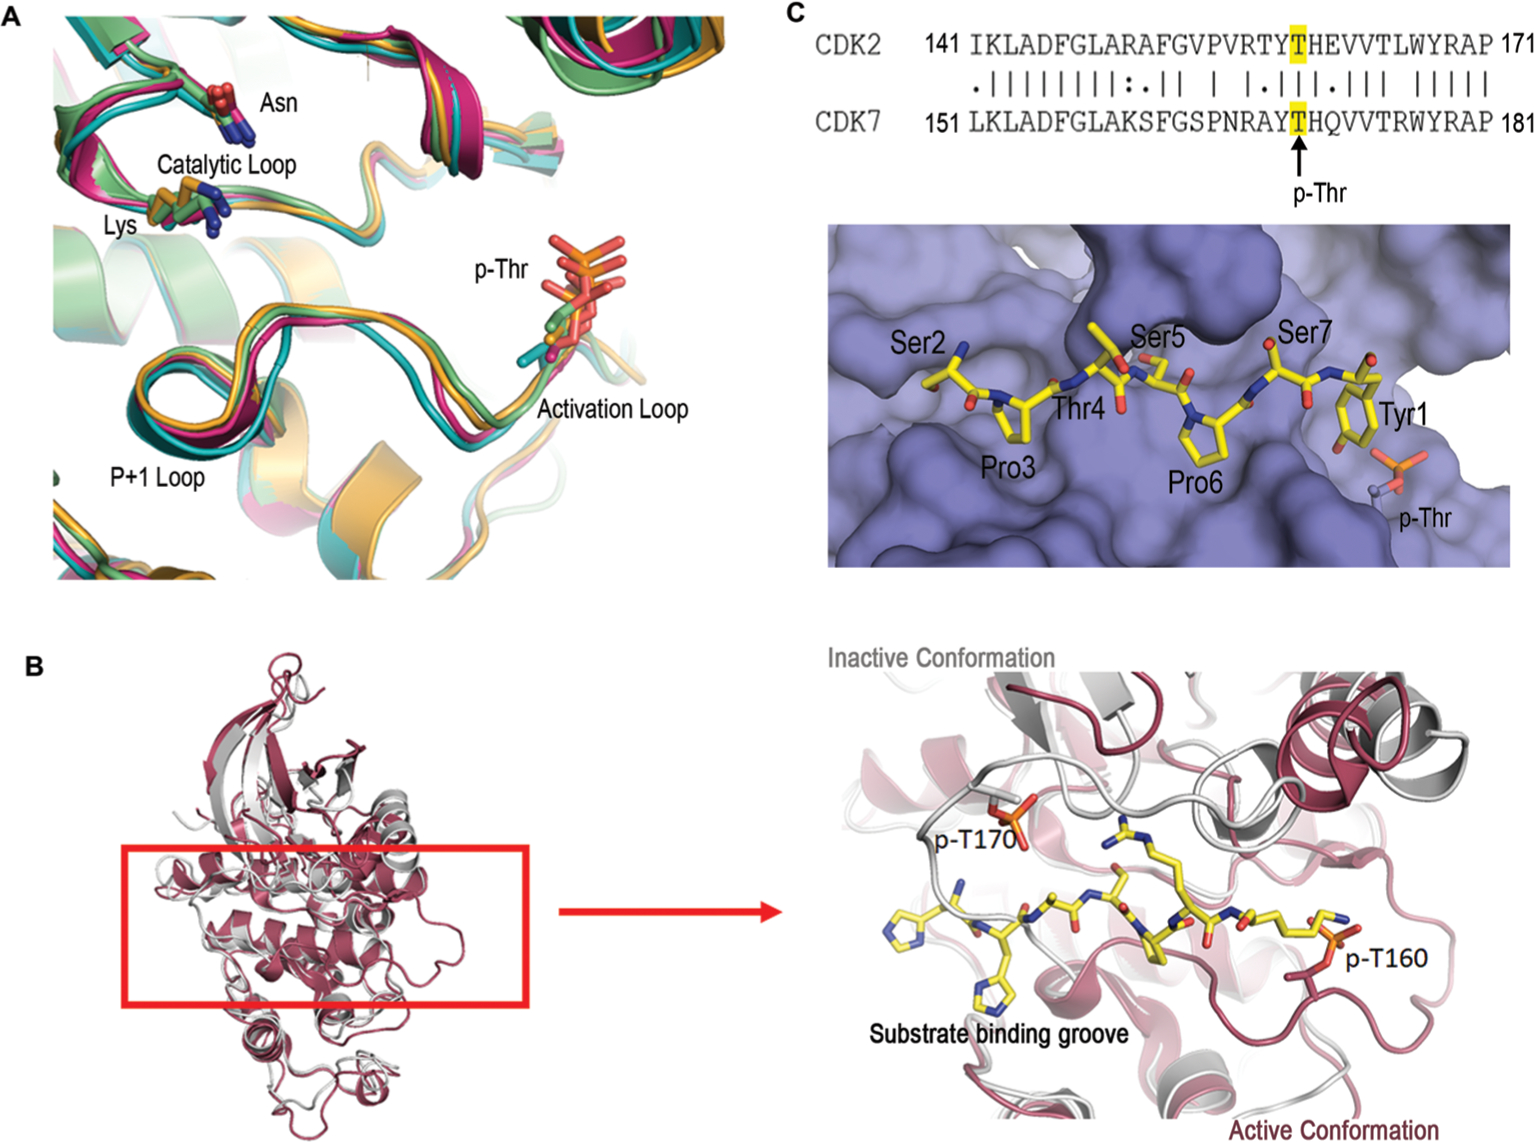
Structural and sequence analyses of CDKs. (A) Structural alignment of activated CDKs zoomed into the active sites: CDK2 (PDB code: 2CCI, light green), CDK9 (PDB code: 6GZH, orange), CDK12 (PDB code: 4CXA, teal), and CDK13 (PDB code: 5EFQ, pink). Structural elements such as the catalytic loop, activation loop, and the P+1 loops are highlighted. Catalytic residues lysine (K), asparagine (N), and phosphoryl-threonine (p-Thr) are shown as the sticks. (B) Structural alignment of CDK2 (PDB code: 2CCI, red) and CDK7 (PDB code: 1UA2, gray) showing differences in the conformation of activation and P+1 loops. The image on the right is a close-up view of the active site with a peptide ligand for CDK2 shown in sticks with carbon atoms colored yellow, nitrogen atoms colored blue, and oxygen atoms in red. A phospho-threonine residue is shown as sticks on both enzymes for comparing the structural differences. (C) Surface representation of the model for the substrate-binding groove active CDK7 with Ser5 phosphorylated. The color scheme for the substrate is identical to that of panel b. The inset is the sequence alignment of the activation/P+1 loops of CDK2 and CDK7: ‘|’ = fully conserved residue, ‘:’ = conservation of residues with strongly similar properties, ‘.’ = conservation of residues with weakly similar properties; no character indicates no conservation. Numbers indicate the positions of the initial and final amino acids.