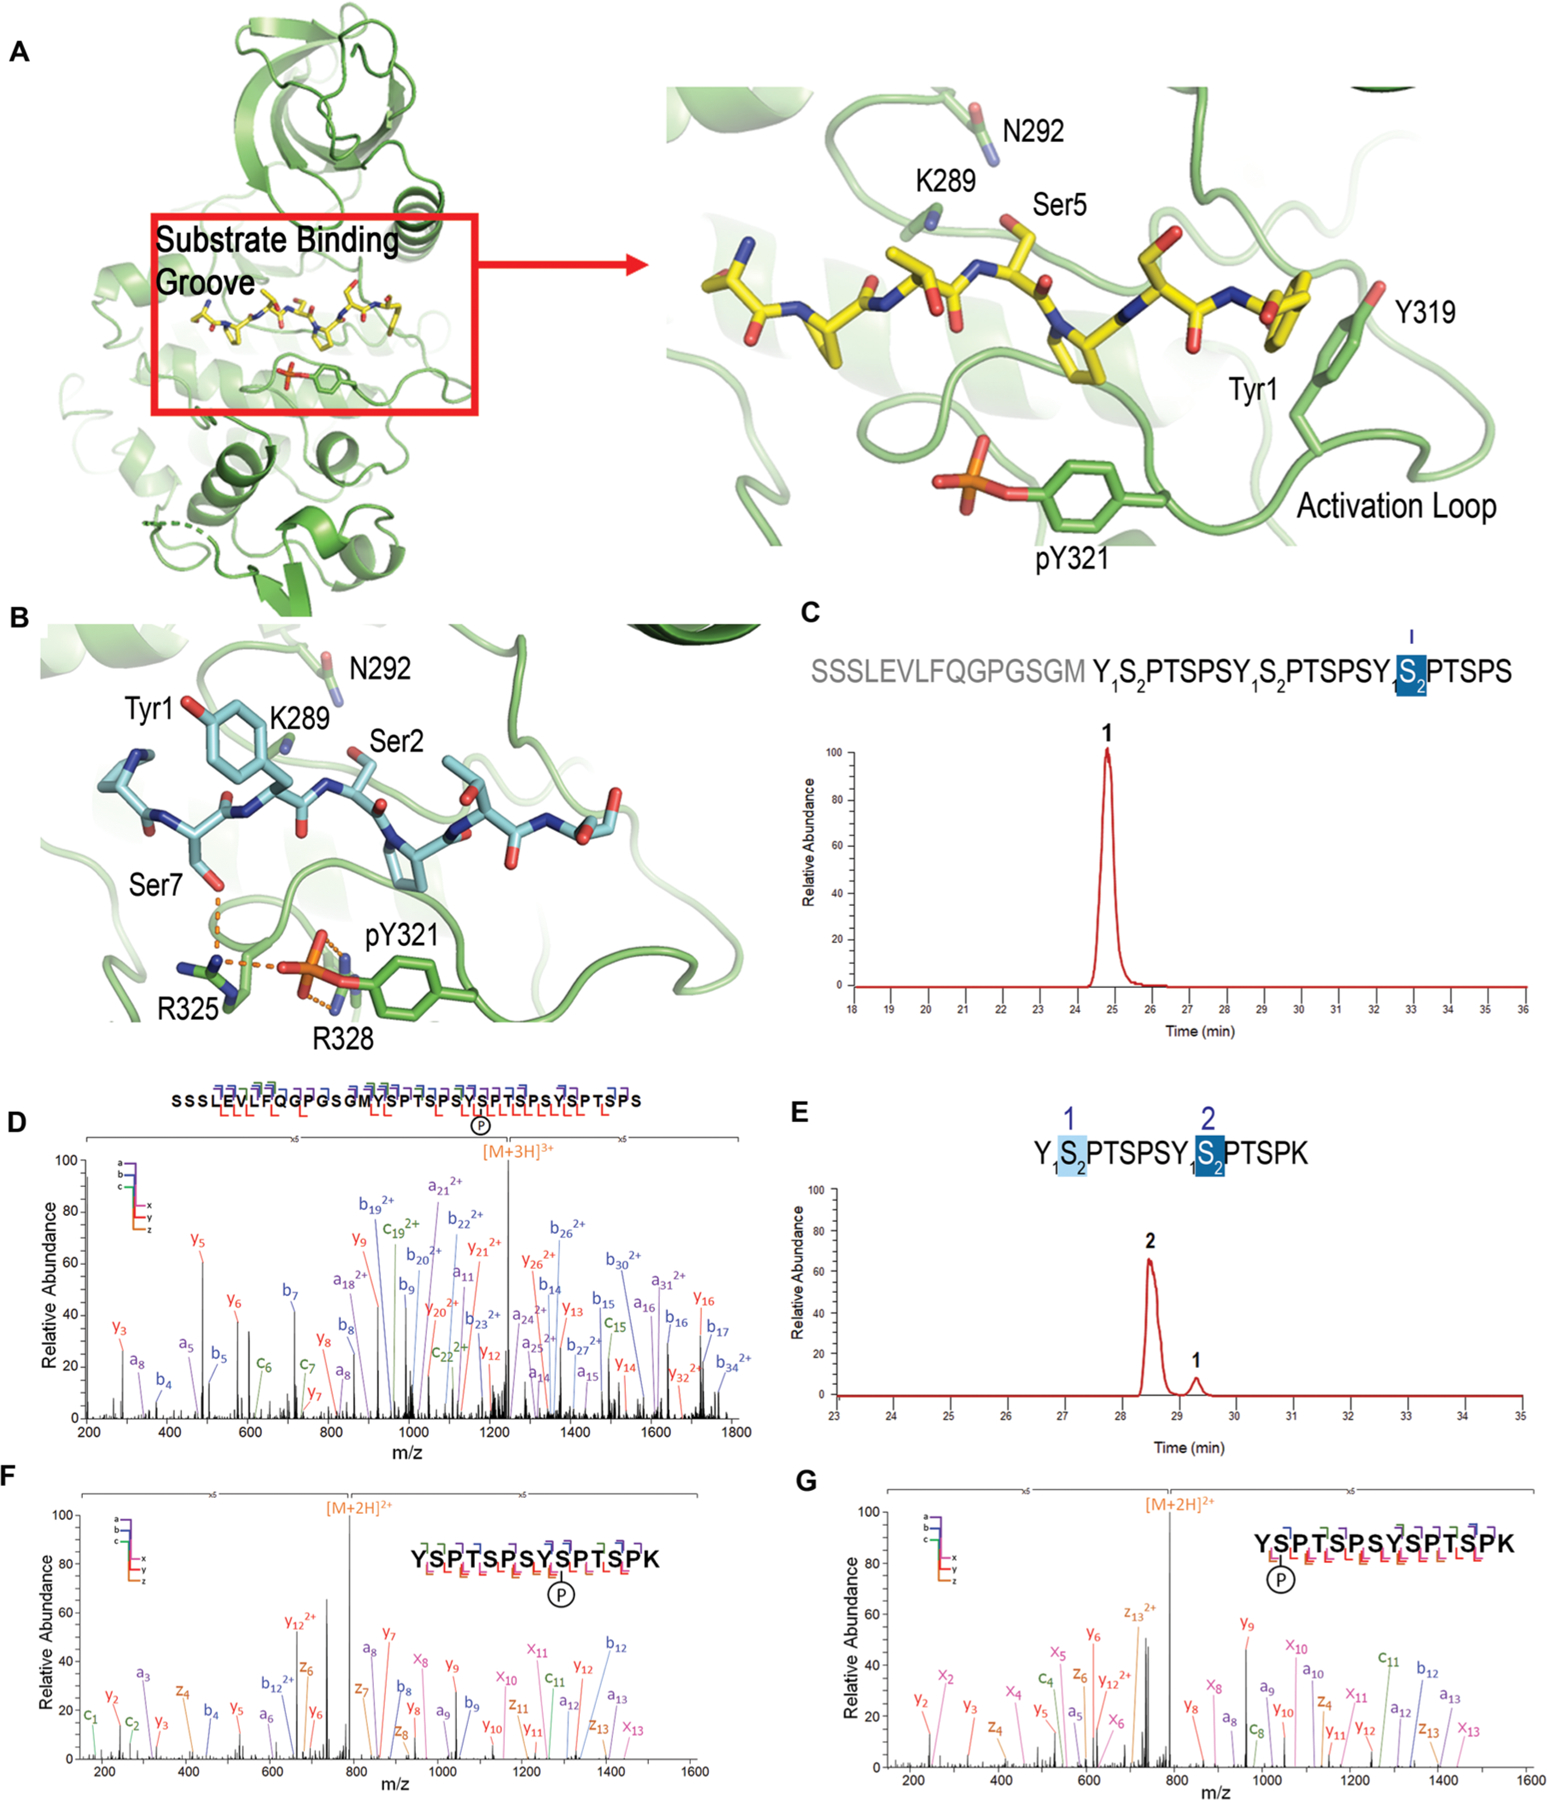
Figure 5.

Modeling/structural analysis and mass spectrometric identification of Dyrk1a specificity. (A) Overall kinase structure of Dyrk1a, and zoomed in picture of the active site interactions of Dyrk1a (green) with the modeled CTD peptide. Ser5 is modeled as the phosphorylable residue. (B) Model of the active site interactions of Dyrk1a with Ser2 for phosphorylation (same color scheme except with carbon atoms in light blue). Catalytic residues K289 and N292 are shown as sticks. (C) Liquid chromatography trace of 3 repeat consensus CTD treated with Dyrk1a. The numbers above each sequence and each chromatographic peak correspond to the specific repeats of the CTD sequence. (D) MS/MS analysis of the peptide shown in panel c. (E) Liquid chromatography trace of 26 repeat S7K spaced CTD treated with Dyrk1a. The numbers above the sequence show the position of phosphates in the diheptad fragments generated from the 26 repeat S7K spaced CTD. The numbers above each chromatographic peak correspond to the specific repeats of the CTD sequence. (F and G) MS/MS analysis of the peptides shown in panel e.
