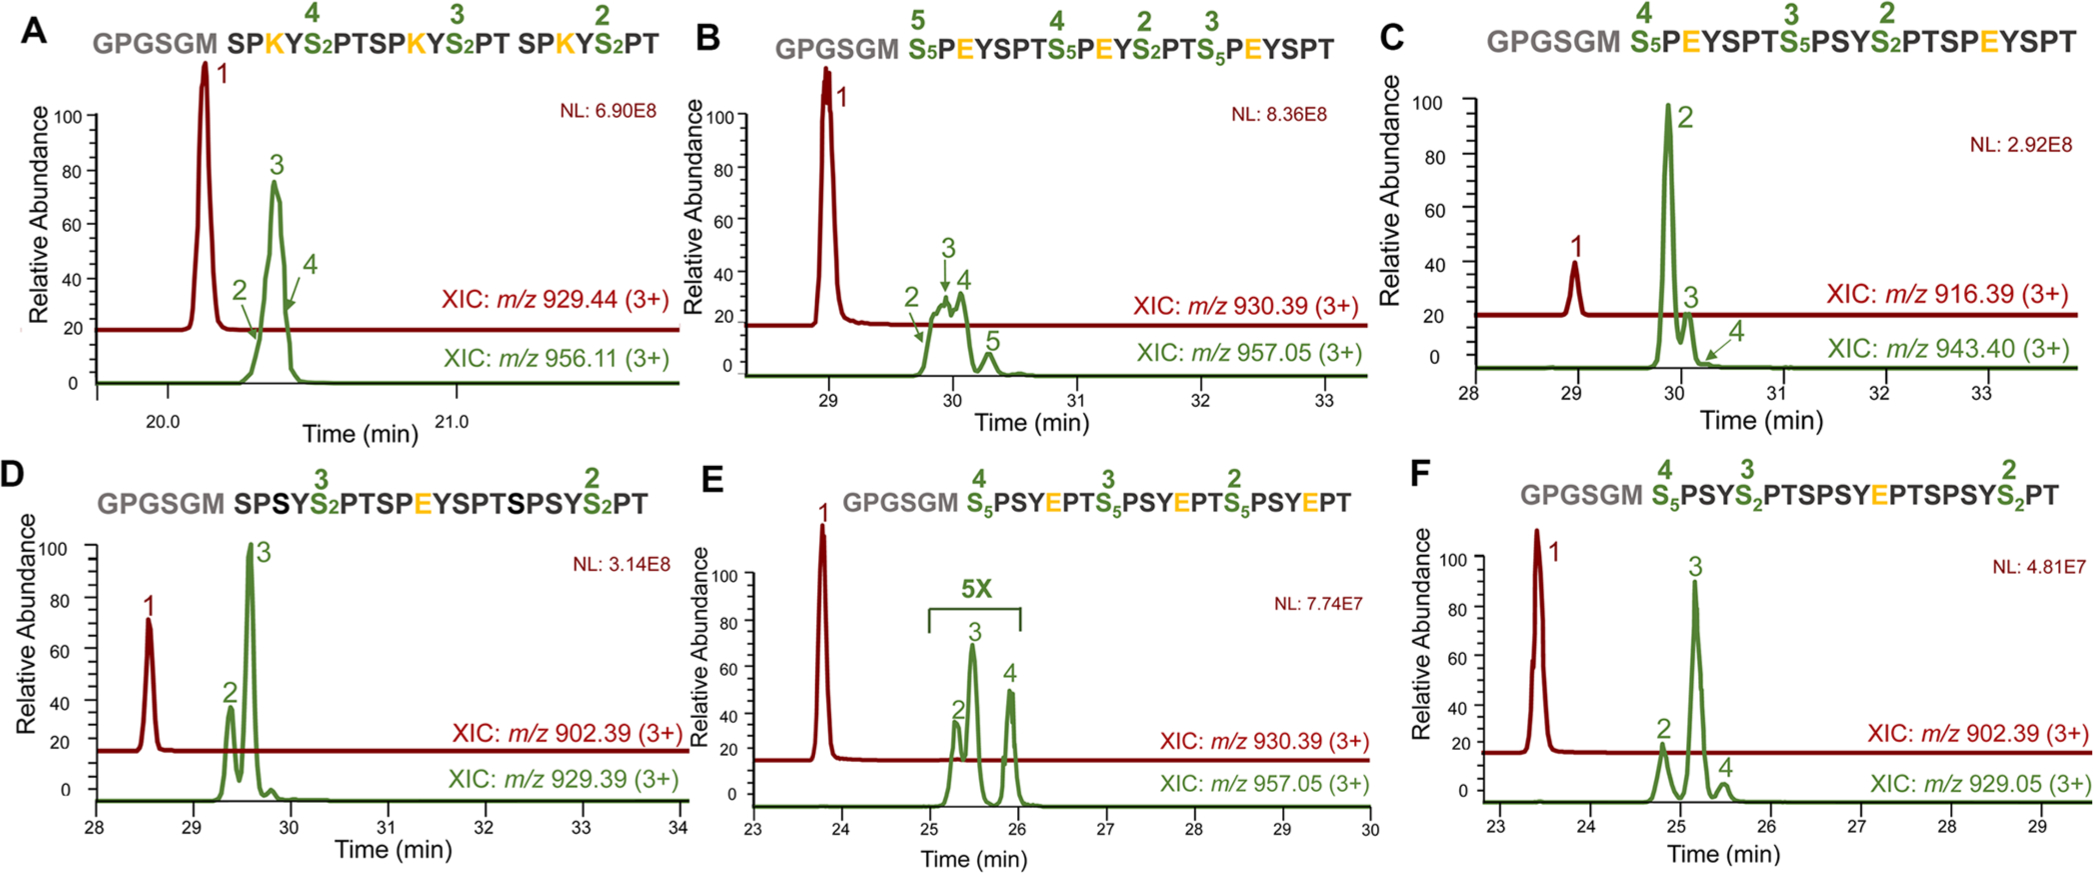
Figure 6.

In-depth LC–MS/MS analysis of Dyrk1a’s specificity using 3X CTD as substrates. Green-colored LC traces indicate monophosphorylated products with peak numbers matching corresponding sites of phosphorylation. (A) 3X CTD S7K treated with Dyrk1a. (B) 3X CTD S7E treated with Dyrk1a. (C) 3X CTD S7E on the first and third repeats treated with Dyrk1a. (D) 3X CTD with S7E only on the middle repeat treated with Dyrk1a. (E) 3X CTD S2E treated with Dyrk1a. (F) 3X CTD with S2E only on the middle repeat treated with Dyrk1a. In all LC-traces, the unphosphorylated peptide is shown as peak 1 colored in maroon. The sequence for each CTD mutation variant is exhibited with green fonts highlighting sites of phosphorylation with numbers matching to corresponding peak intensities of monophosphorylated species. The residues varied from the consensus sequence are colored yellow.
