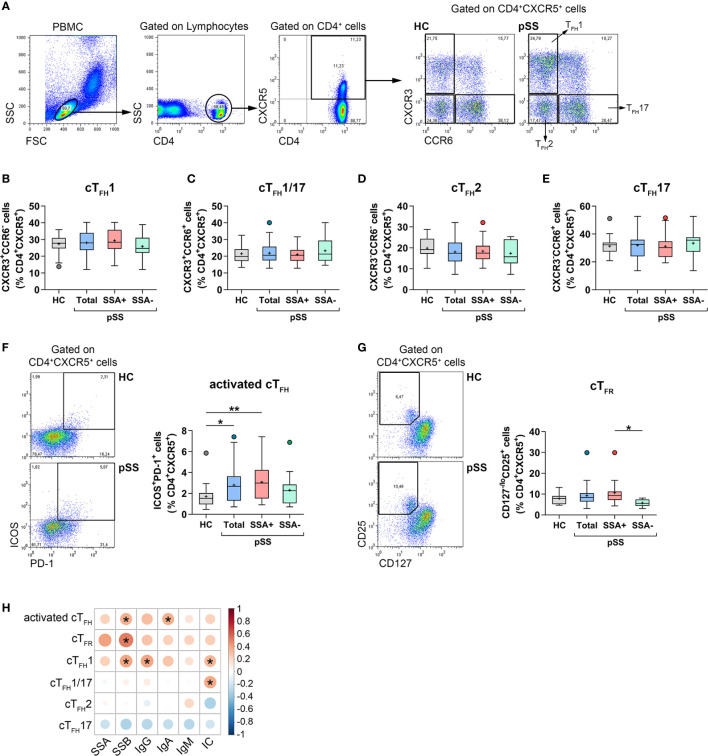
Figure 1.
The distribution of cTFH subsets and TFR cells in patients with pSS and their association with laboratory serological markers. PBMCs were isolated from 38 pSS patients and 29 healthy controls (HC) then were stained with fluorochrome-labeled antibodies as described previously. Peripheral circulating (c)TFH subsets were quantified as their percentage within CD4+CXCR5+ lymphocyte population. (A) Representative dot plots show the gating strategy and the division of TFH cell subpopulations. Percentages of cTFH1 (B), cTFH1/17 (C), cTFH2 (D), cTFH17 (E) in pSS patients (n = 38), pSS without anti-SSA(−) (n = 14), pSS with anti-SSA(+) (n = 24) and HCs (n = 29). (F) Representative dot plots show the gating of ICOS+PD-1+ activated cTFH cells in pSS and HC. Percentages of activated cTFH cells. (G) Representative dot plots display the gating of TFR cells in pSS and HC. Frequencies of TFR cells. (H) Correlation analysis of the percentages of TFH cell subsets and TFR cells with different serological parameters in patients with pSS. One-way ANOVA with Tukey’s multiple comparisons test (B, D, E) or Kruskal–Wallis test with Dunn’s multiple comparisons test (C, F, G) was used. Correlation analysis was performed using Spearman’s test (H). Box plots represent the interquartile range (IQR) with a line in the middle as median and “+” sign as the mean value. Statistically significant differences are indicated by *p < 0.05; **p < 0.01.

