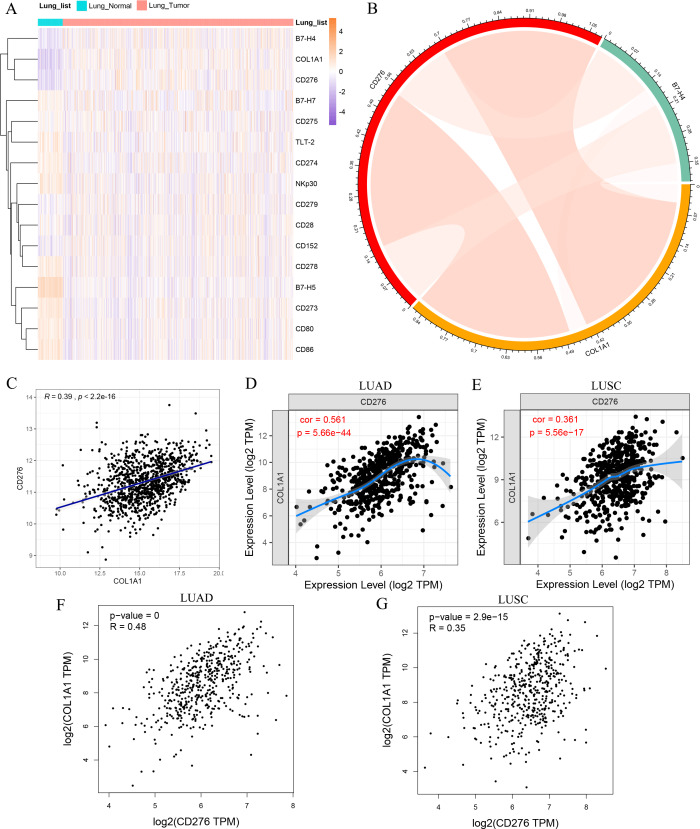
Figure 6. The correlation between COL1A1 and inflammatory activities.
(A) The coexpression between COL1A1 and the B7-CD28 ligand–receptor family. (B) The correlation between FN1, CD276 and B7-H4 in the LC cohort. The correlation between COL1A1 and CD276 analyzed by THCA datasets (C), TIMER (D-E) and GEPIA (F–G).

