
Figure 4: Assessing distributions of inter-dye distances with fluorescence lifetime information.
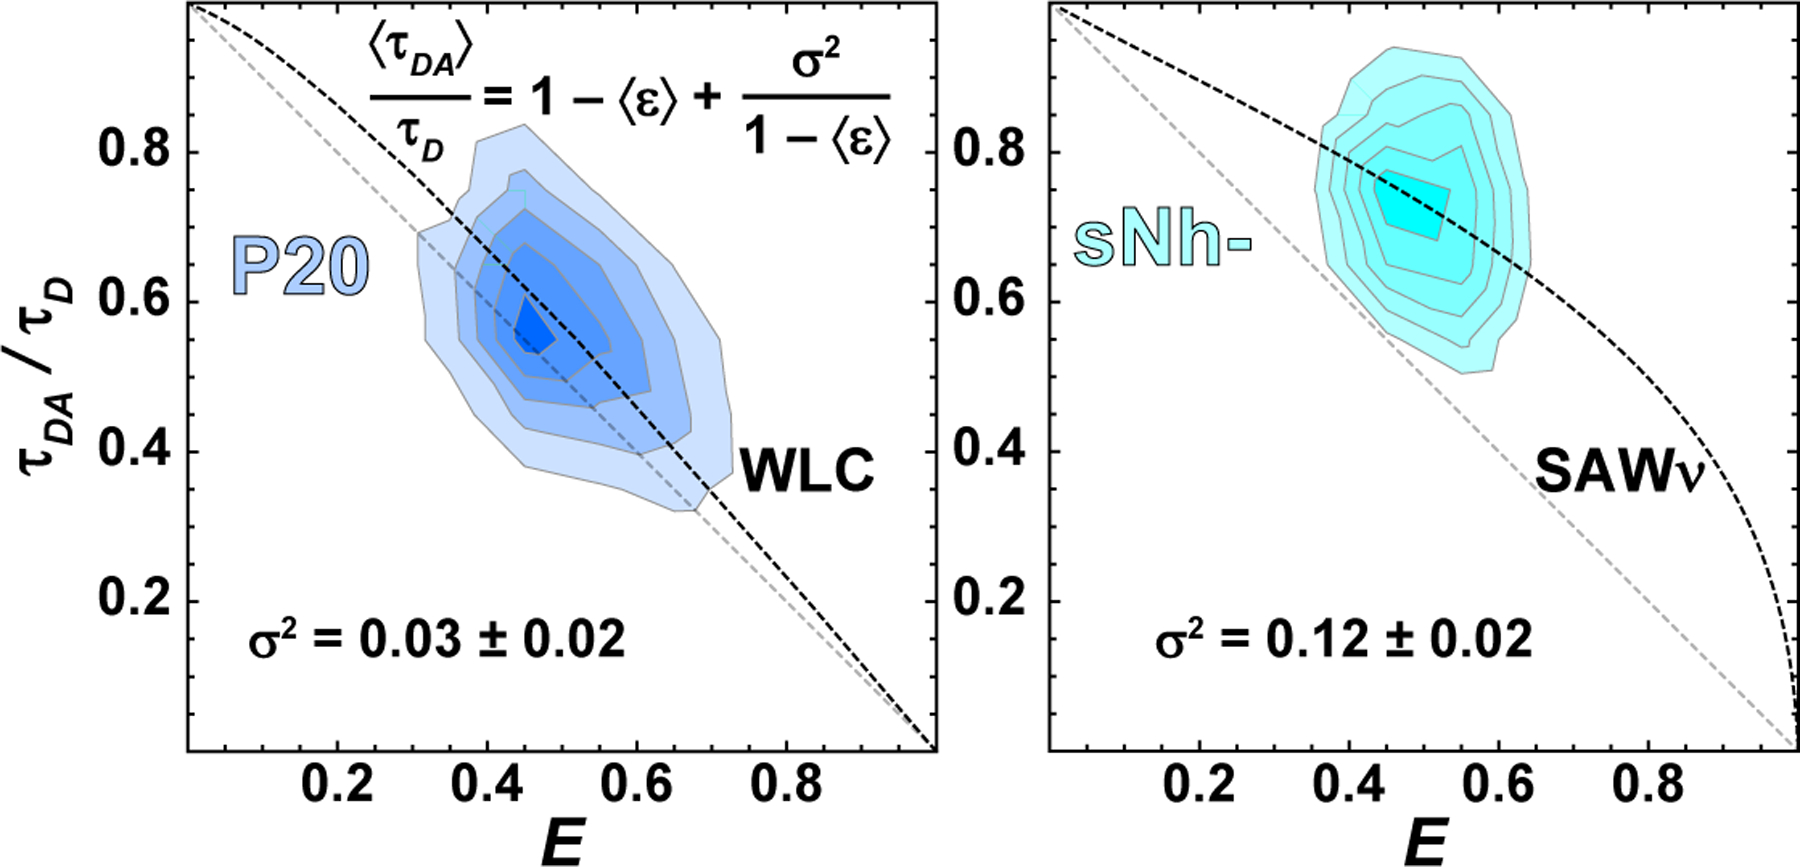
With pulsed interleaved excitation, it is possible to determine the relative donor lifetime in the presence of the acceptor, τDA/τD. This parameter provides information about the variance of the underlying distribution of transfer efficiencies. (left) In the case of a static distribution of distances in a 20-mer polyproline peptide (R. Best et al., 2007; Schuler et al., 2005), the values of 〈τDA〉/τD cluster close to the diagonal, which corresponds to a single fixed distance (static FRET line), 〈τDA〉/τD = 1 − ε. (right) However, for a broad and rapidly sampled distribution, for example the intrinsically disordered peptide sNh−, values of τDA/τD cluster above the diagonal. This vertical displacement provides a measure of the variance of the underlying distribution of transfer efficiencies, σ2. In this way, lifetime vs. transfer efficiency plots can be used to assess the quality of polymer models (i.e., self-avoiding walk (Zheng et al., 2018), or worm-like chain (O’Brien, Morrison, Brooks, & Thirumalai, 2009)) commonly used to describe FRET-labeled biomolecules. The error of σ2 was estimated assuming an uncertainty of ~0.1 ns for both τD and τDA.