
Figure 5. Illustration of the ambiguity in inferring a distance distribution from limited FRET data.
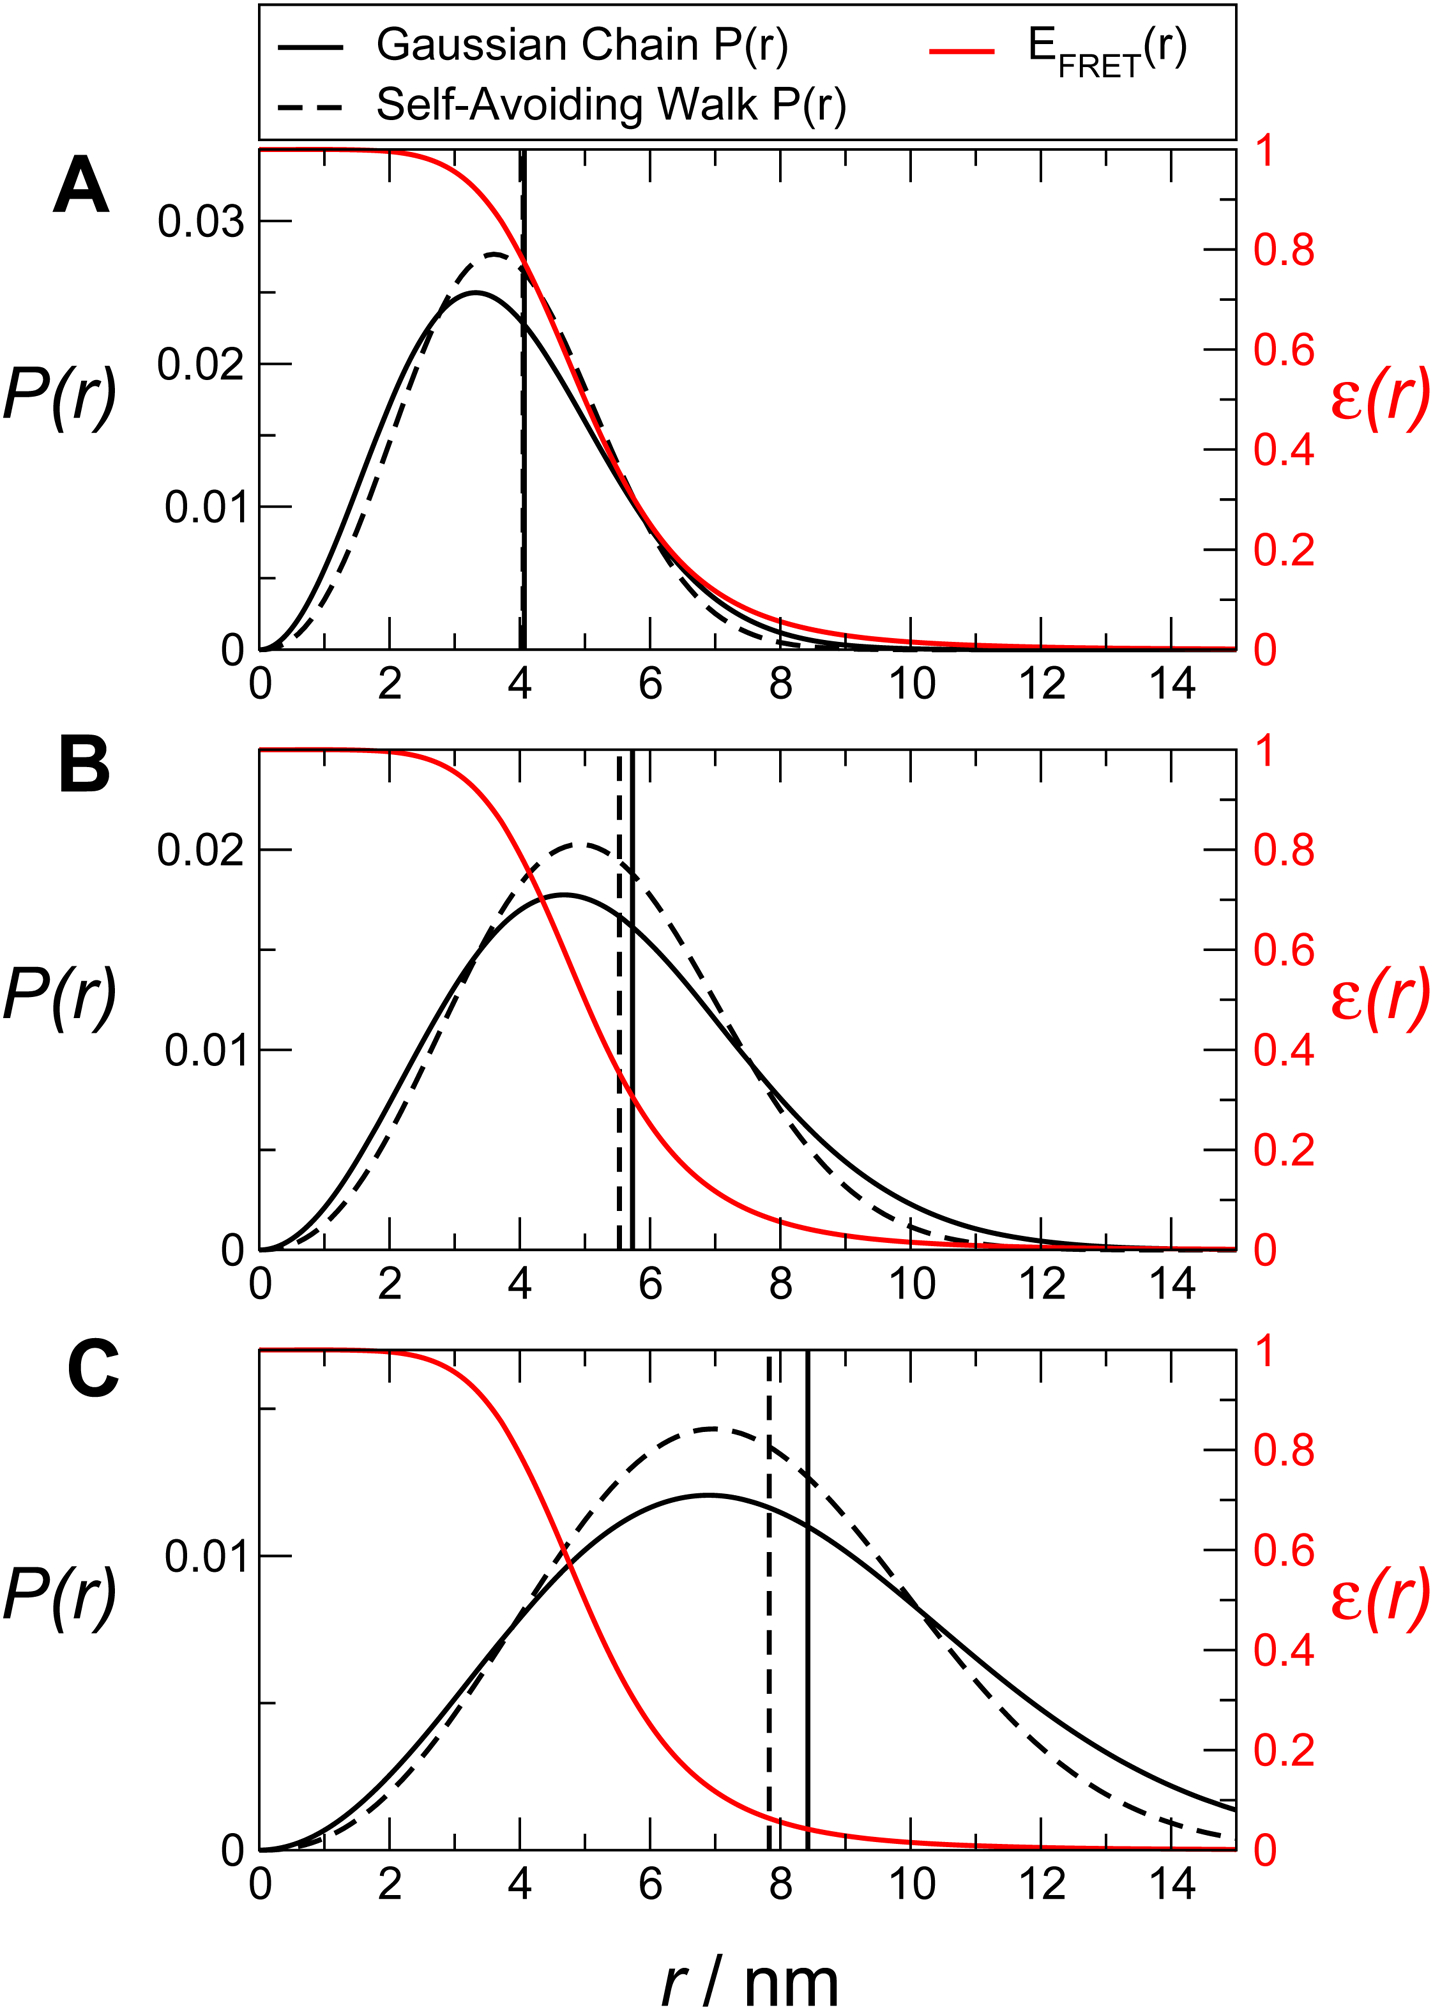
Distributions with mean efficiencies of 〈ε〉 = 0.75, 0.5, and 0.25 are shown in A, B, and C, respectively. In each case, the P(r) for a Gaussian chain and a self-avoiding walk corresponding to the same FRET efficiency are shown. The variances of the corresponding transfer efficiency distributions, σ2, for the Gaussian chain and self-avoiding walk, respectively, are 0.08 and 0.07 in A, 0.13 and 0.11 in B, and 0.10 and 0.09 in C.