
Figure 7. Bayesian ensemble reweighting of simulations of unfolded R17.
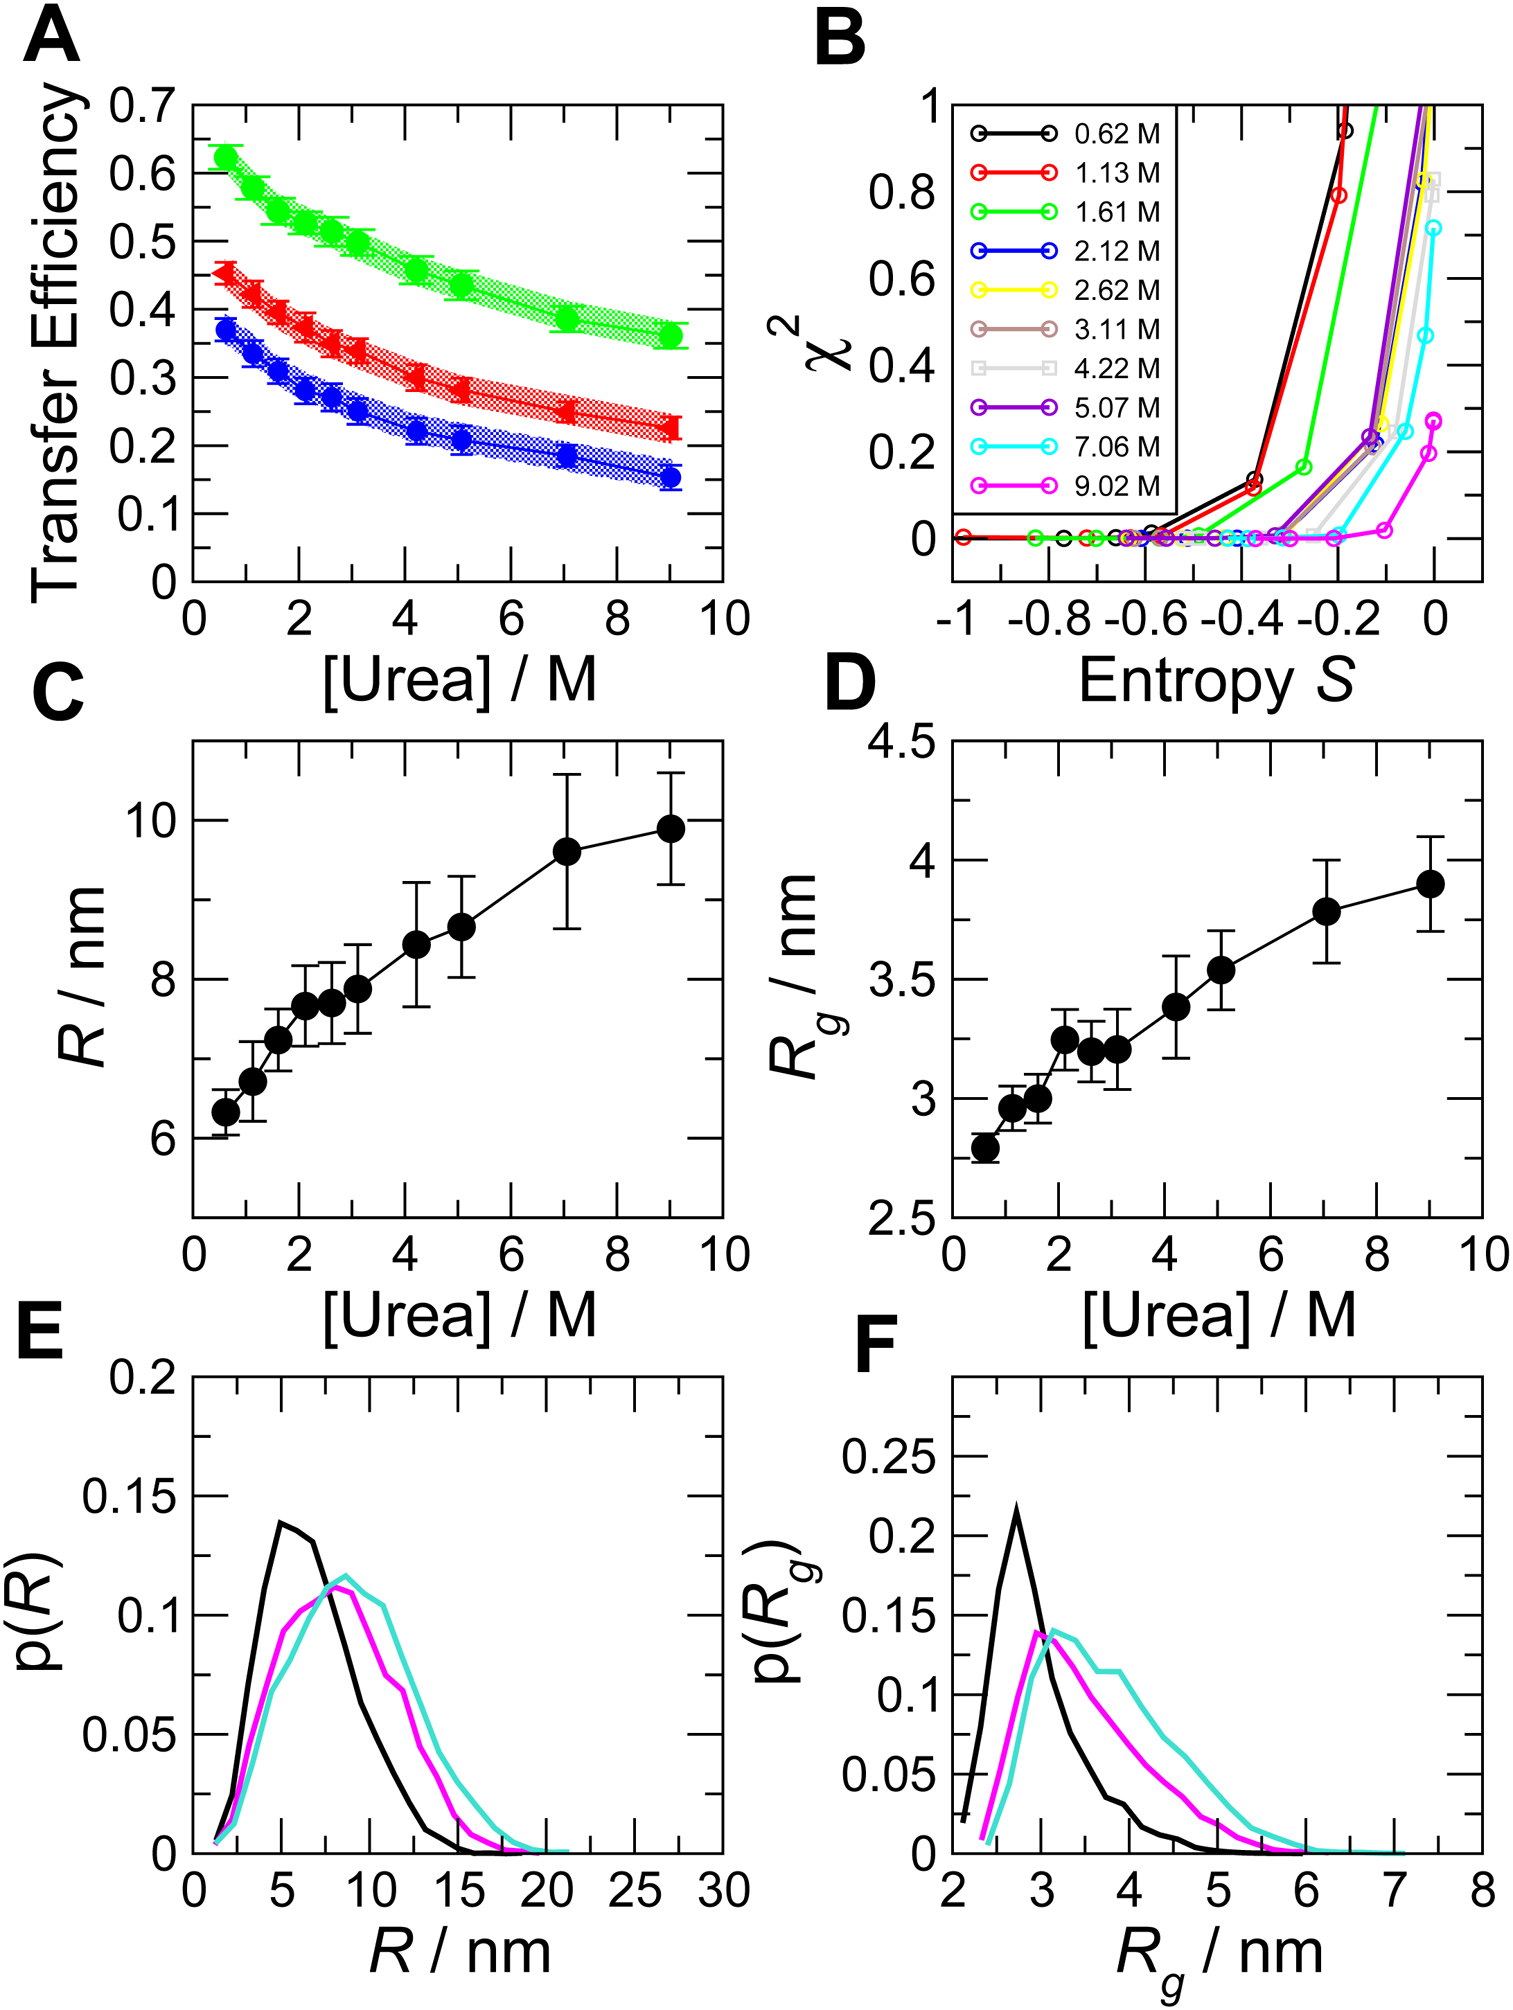
(A) FRET efficiency data versus denaturant concentration. Shaded regions show experimental confidence intervals (standard error), symbols and error bars show the values calculated from the reweighted ensemble. (B) Variation of χ2 and S as the control parameter K is varied. Each curve corresponds to a given denaturant concentration (see legend) and each point to a particular value of K. Root mean square (C) distance, R, and (D) radius of gyration, Rg, are recovered as a function of denaturant. In (E) and (F) we show, respectively, examples of distribution functions for r and rg (color code is: black, 1.13 M urea; magenta, 5.07 M urea; cyan, 9.02 M urea).