
Figure 8: Fitting a coarse-grained model to experimental FRET efficiencies.
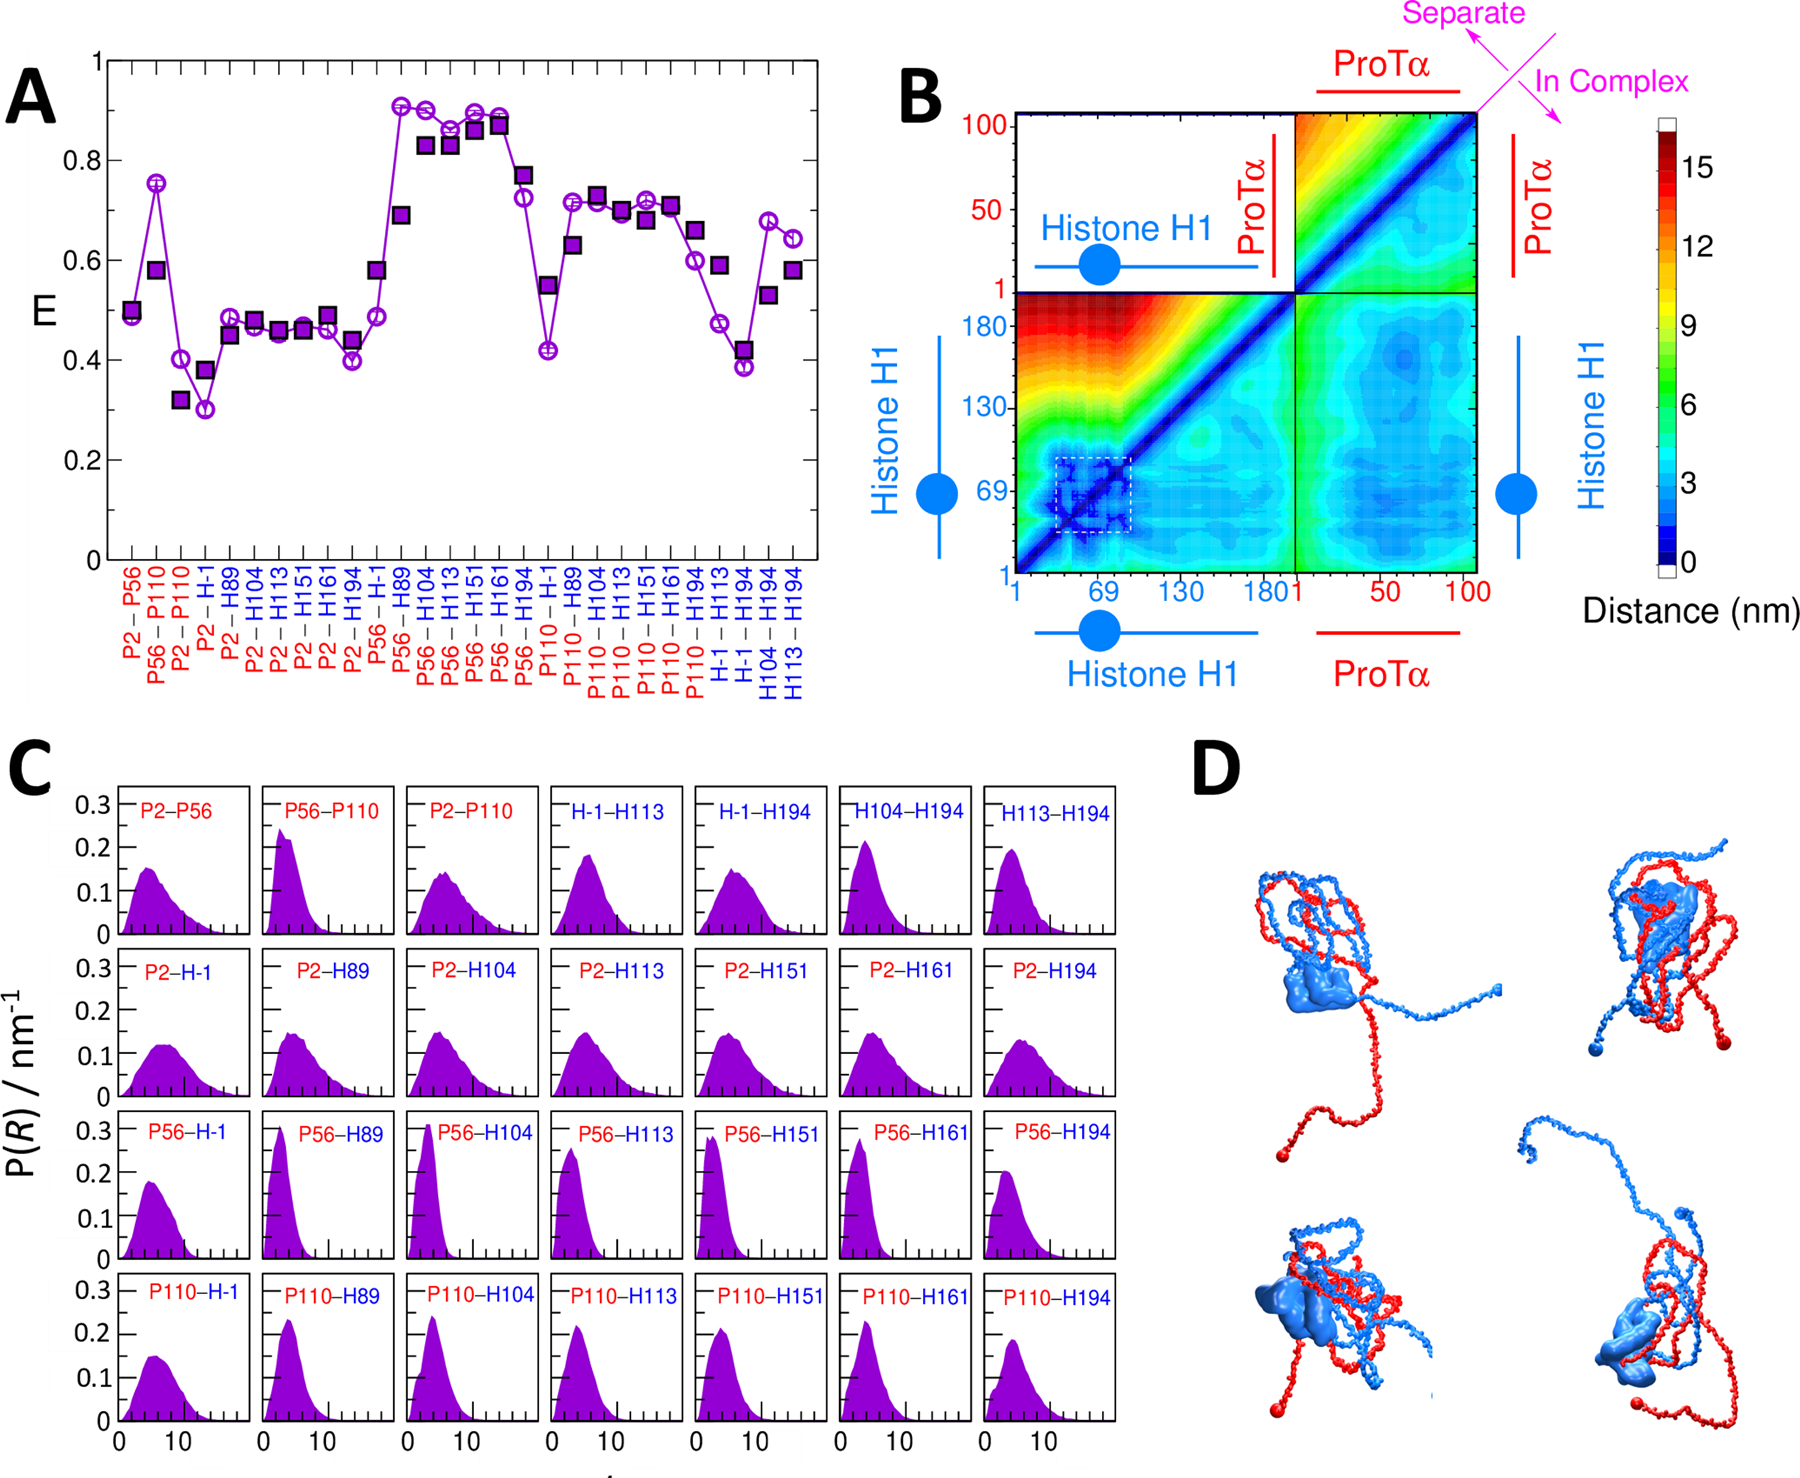
(A) Experimental (solid symbols) transfer efficiency data for inter- and intramolecular labeling pairs in the complex between ProTα and H1 (red: ProTα residue; blue: H1 residue). Empty symbols show results from the fitted model. (B) Average inter- and intramolecular pair distances between the two proteins. Blue circle in schematic of H1 represents the folded domain. (C) Pair distance distributions for labeled residue pairs from simulations with optimized energy function. (D) Example structures of ProTα-H1 complex.