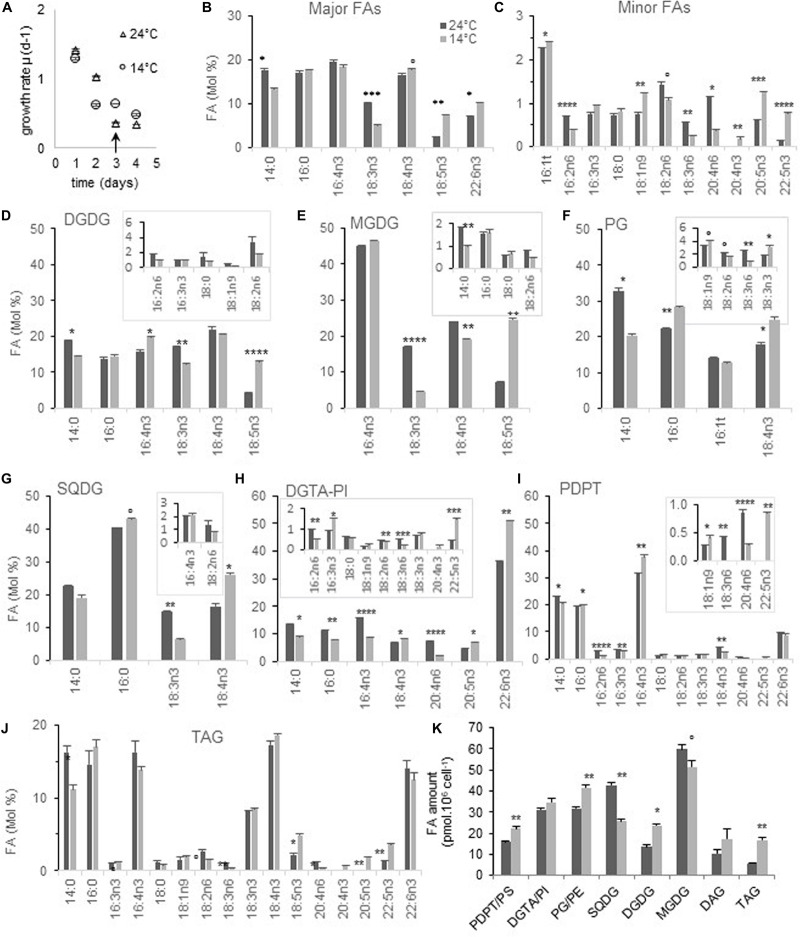
FIGURE 1.
FA and glycerolipid profiles from cells acclimated to 24 and 14°C. Cells were grown under continuous light and acclimated at each temperature before sampling. FAs ≤ 0.5% at both temperatures are not plotted except for 20:4n3 and PDPT. (A,B) Global FA profiles from glycerolipid analysis. (C) Growth rate of corresponding cultures; arrows indicate the sampling time. (D–K) Glycerolipid FA composition. Minor FAs are highlighted in framed inserts. Means and standard errors to the mean (SEM) from biological triplicate are shown. Marks correspond to statistical significant differences by unpaired t-test (°P < 0.02, *P < 0.01, **P < 0.001, ***P < 0.0001, and ****P ≤ 0.00001).

