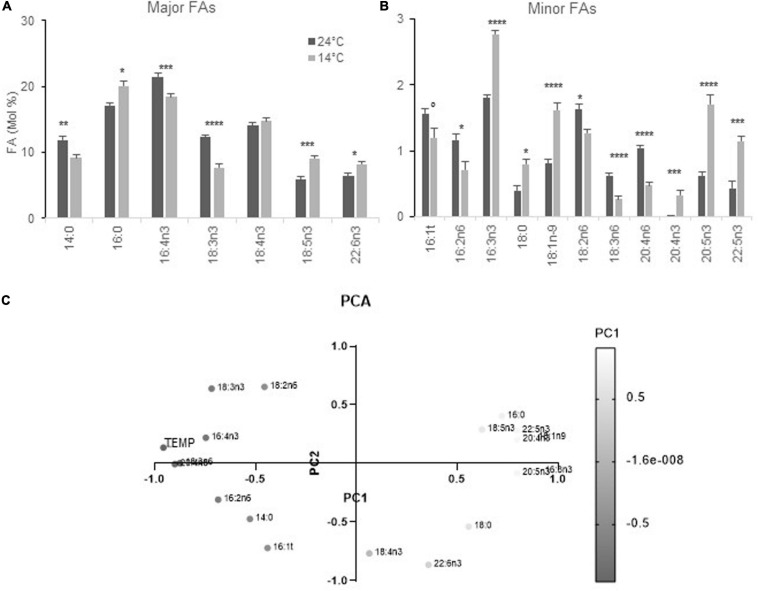
FIGURE 2.
FA profiles from cells acclimated to 24 and 14°C under diurnal conditions. Cells were grown under light-dark cycles (16–8 h). (A,B) FA-profile from cells collected at 4–4.5 h after light on. Means and standard errors to the means of 15 samples (extracted from four independent experiments) are shown. Marks correspond to statistical significant differences by unpaired t-test (°P < 0.05, *P < 0.01, **P < 0.001, ***P < 0.0001, and ****P < 0.00001). (C) Principal component analysis (PCA) of FAs and temperatures from the same data set. PC1 corresponds to 50.27% of the variance and PC2 to 19.96% (cumulative proportion of the variance 70.23%). The gray gradient applies for the value on PC1 the lightest being the lowest.

