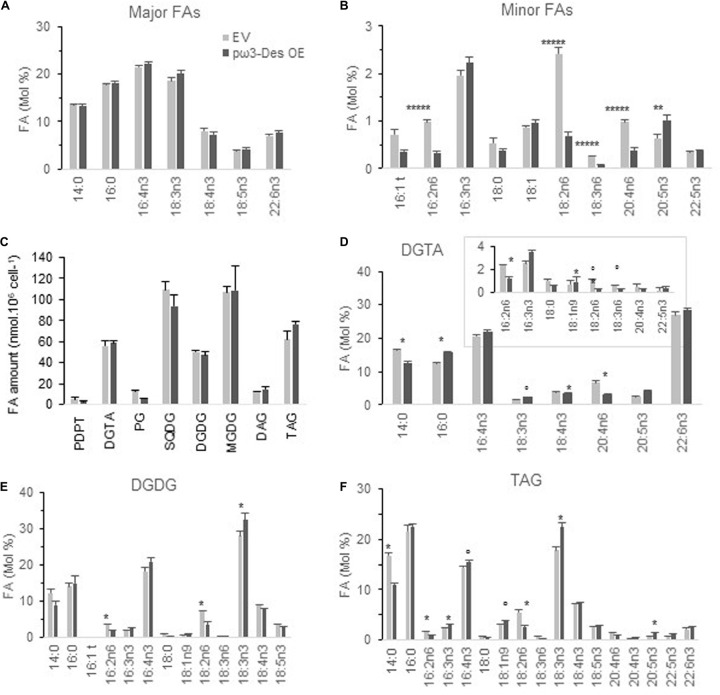
FIGURE 6.
Glycerolipid profiles of O. tauri pω3-Des OE. (A,B) FA profiles of transgenics at stationary phase, 20°C. Means and standard errors are shown (n = 12 from three independent experiments and five pω3-Des OE different lines). Asterisks indicate statistically significant differences by Wilcoxon–Mann–Whitney test (**P < 0.005; *****P < 0.000001). Expression and luminescence levels of transgenics are available from Supplementary Figure 10. (C) Glycerolipid content of one pω3-Des OE line in mid-exponential growth. (D–E) FA profile of glycerolipids, DGTA (D), DGDG (E), and TAG (F). Marks indicate statistically significant differences by t-test (°P < 0.02 and *P < 0.01). MGDG, SQDG are shown in Supplementary Figure 11. Means and standard errors from three independent experiments are shown.

