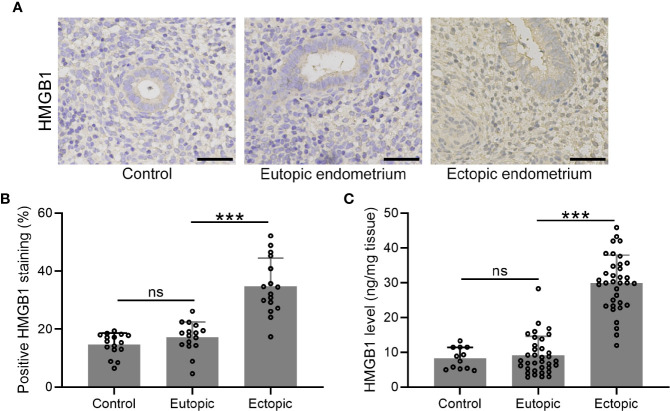
Figure 1.
The expression patterns of HMGB1 in the endometrial tissues. (A) Immunohistochemical staining showed the protein localization of HMGB1 in normal endometrium, eutopic endometrium, and ectopic endometrium (magnifications of 200×, scale bar: 50 μm). (B) The positive HMGB staining in each group was qualified using ImageJ (n = 15). (C) The protein levels of HMGB1 in these groups were determined using specific ELISA (n=12 for the control group and n= 35 for eutopic and ectopic groups). The data were expressed as means ± SD. One-way ANOVA followed Dunnett’s T3 multiple comparisons test was performed. ***P < 0.001 indicates significant difference. ns indicates no significant difference.

