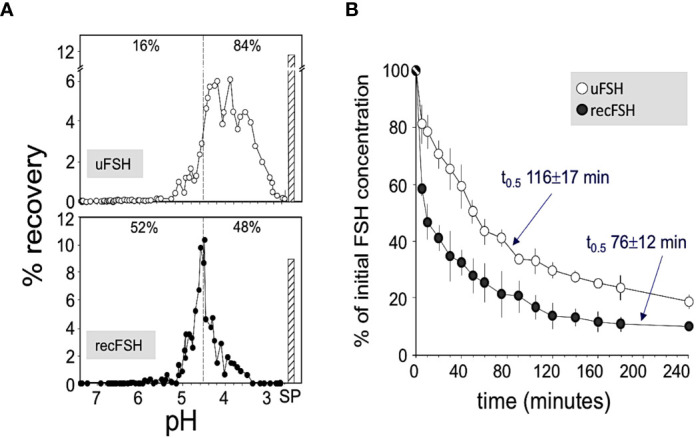
Figure 2.

(A) Representative patterns of pH distribution of immunoreactive FSH after chromatofocusing of highly purified urinary FSH (upper panel; Fertinorm HP, formerly distributed by Serono, Switzerland) and recombinant follitropin beta produced by CHO cells (lower panel; Puregon, Organon International BV, Oss, The Netherlands). Vertical broken lines separate charge isoforms with pH values >4.5 and <4.5. The percent recoveries within each pH window are indicated at the top of each pattern. SP, salt peak. (B) Plasma disappearance curves of urinary FSH (uFSH) or recombinant FSH produced in CHO cells, from rat circulation. Approximately 60 µg of immunoreactive uFSH or recombinant FSH were injected i.v. and blood samples were obtained at 5 and 10 min after the injection and thereafter at regular time intervals during the ensuing 4 h. Samples were analyzed for FSH content by a specific human FSH fluoroimmunoassay. Values are mean ± SEM of three to five independent studies. Reproduced from (10) with permission.
