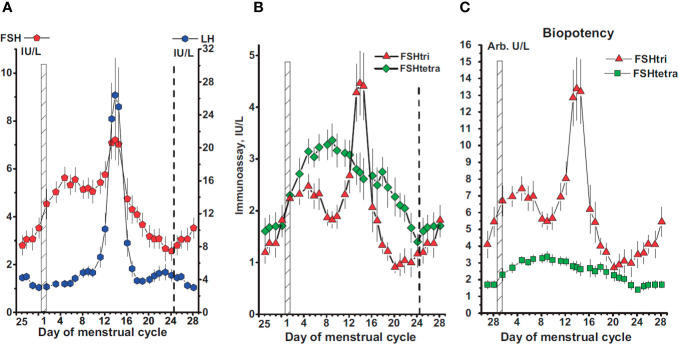
Figure 6.
(A) Concentrations of FSH and LH in serum samples from 78 women with a normal menstrual cycle. The day of the menstrual cycle is given and the first day indicated by a vertical hatched bar. The ovarian cycle starts on day 25 of the previous cycle and lasts to day 24 of the menstrual cycle, the end indicated by a vertical dashed line. (B, C) Concentrations of FSH-tri and FSH-tetra (B), and their estimated biopotencies (C), in arbitrary units per L, during the normal menstrual cycle. Data in this figure are plotted as three-day moving mean values. Reproduced from (86) with permission.

