
FIGURE 4.
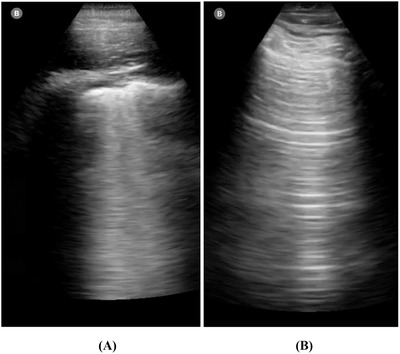
Two examples of cases that were diagnosed correctly by quantitative TLT analysis. The 2 cases showed different texture patterns. The COVID‐19 case (A) showed higher echogenicity and lower heterogeneity, RLNU, and GLNU. Although the normal case (B) showed lower echogenicity and higher heterogeneity, RLNU, and GLNU. COVID‐19, coronavirus disease 2019; GLNU, gray‐level non‐uniformity; RLNU, run length non‐uniformity; TLT, traditional lung texture