
FIGURE 6.
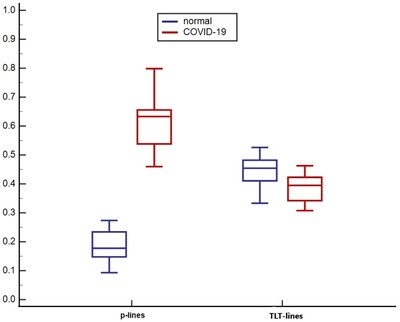
A box and whisker graph comparing the separation power of the 2 feature groups. P‐line features show a clear separation between normal and COVID‐9 cases whereas cases are closely distributed with TLT features. X‐axis represents equally weighted normalized features. COVID‐19, coronavirus disease 2019; p‐line, pleural line; TLT, traditional lung texture