
Figure 2.
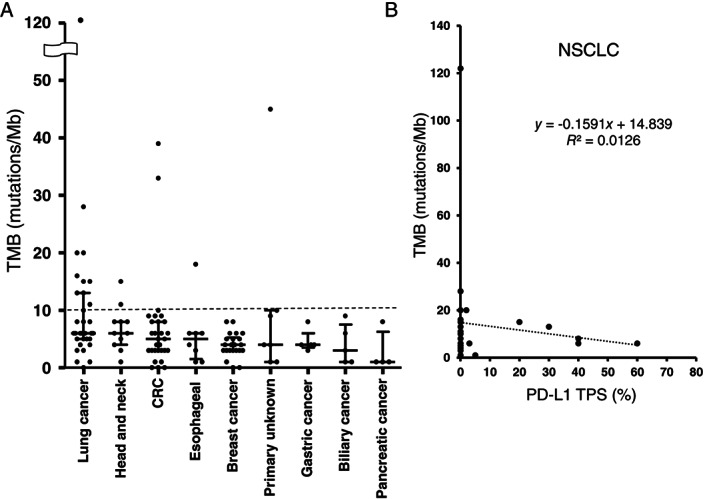
(A): Distribution of TMB according to tumor type. Bars indicate median and quartile values; the dashed line indicates the cutoff (10%) for high and low values. (B): Regression analysis for TMB and PD‐L1 TPS in patients with NSCLC (n = 26).Abbreviations: CRC, colorectal cancer; NSCLC, non‐small cell lung cancer; PD‐L1, programmed cell death–ligand 1; TMB, tumor mutation burden; TPS, tumor proportion score.