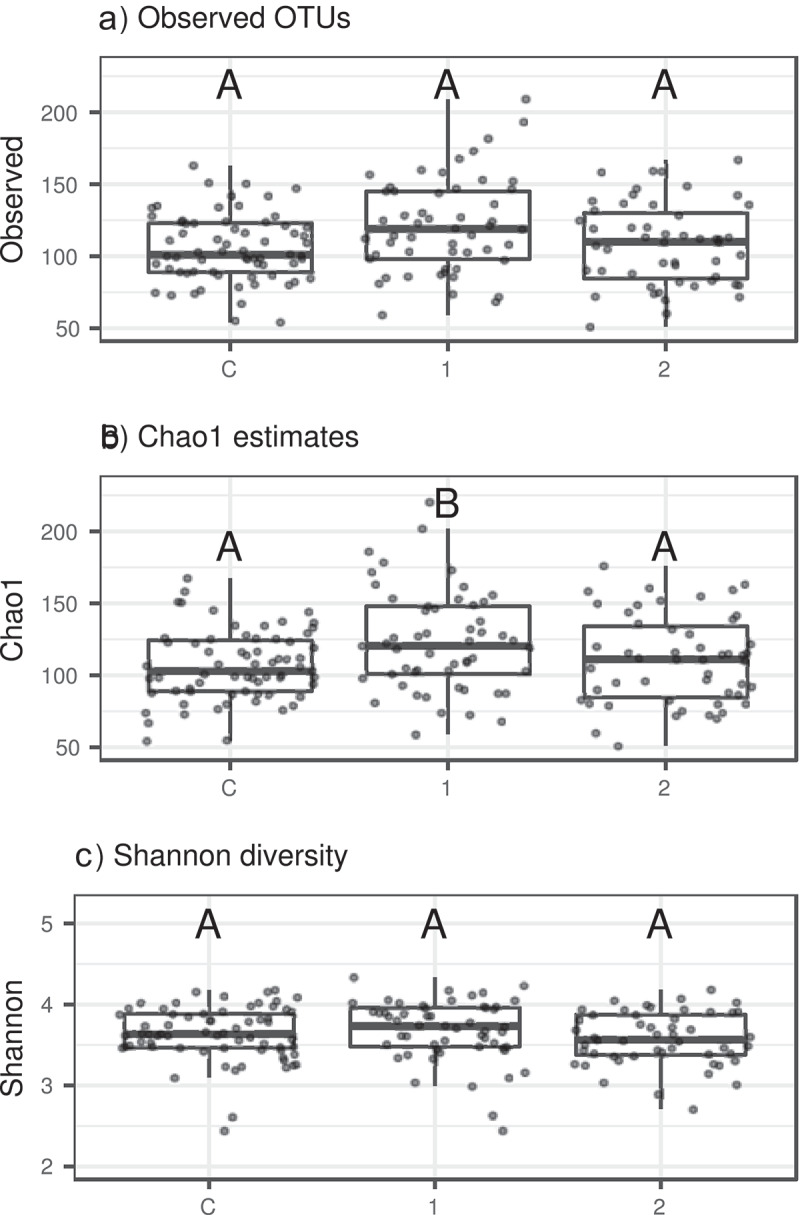
Figure 1.

Gut bacteriome alpha diversity variation between control individuals vs. AN1 vs. AN2 assessed based on A) Observed OTUs number, B) Total OTU richness predicted by Chao 1 index, and C) Shannon index. Significant differences between categories (p < 0.05 according to Tukey post-hoc tests) are indicated by different letters above the bars
