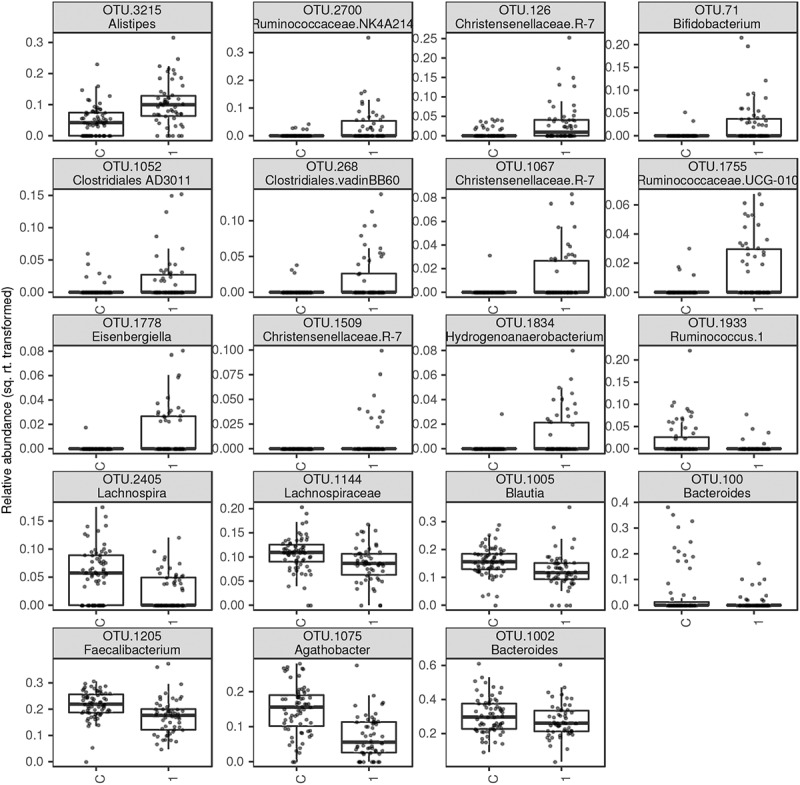
Figure 5.

Relative abundances of bacterial OTUs (squared-root transformed) that varied, according to DESeq2 analyses (FDR < 0.05), between control samples and AN1

Relative abundances of bacterial OTUs (squared-root transformed) that varied, according to DESeq2 analyses (FDR < 0.05), between control samples and AN1