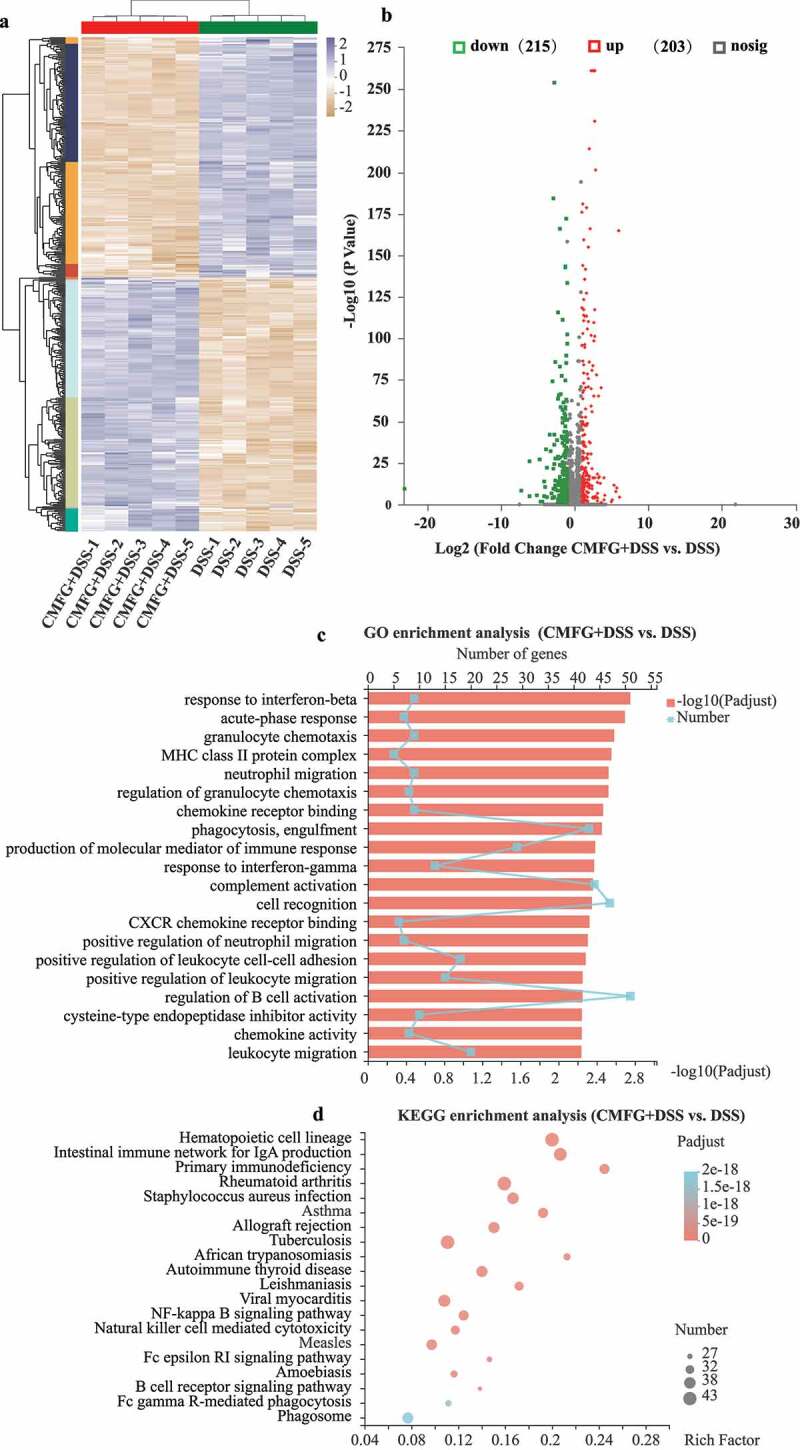
Figure 2.

RNA-seq data exhibit distinct colonic function in colonic tissues. A) Heatmap summary of the differentially expressed genes. The scale bar shows the gene expression in each group. B) Volcano plot of differentially expressed transcripts with DSS and CMFG + DSS groups. C) GO enrichment of up-regulated and down-regulated genes in DSS vs. CMFG + DSS. D) KEGG enrichment of up-regulated and down-regulated genes in DSS vs. CMFG + DSS, n = 5 per group
