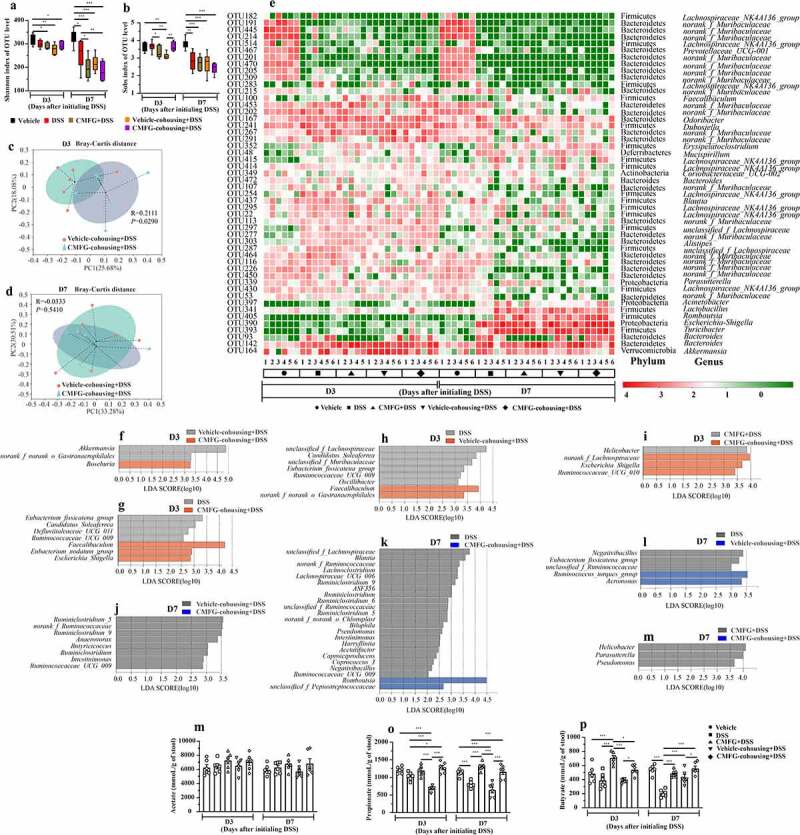
Figure 10.

Cohousing of CMFG-dosed mice alters the gut microbial composition and SCFAs production. A) Shannon index of OTU level. B) Sobs index of OTU level. The PCoA of the gut microbiota was analyzed in different treatments at day 3 (c) and day 7 (d). E) shows the relative abundance of microbial OTUs, classified at the phylum and genus level, in different groups. Linear discriminate analysis effect size (LEfSe) was performed to determine the difference in abundance at day 3 (f-i), and at day 7 (j-m). SCFAs concentrations from feces in different groups are shown in N (acetate), O (propionate) and P (butyrate). Asterisks denote significant differences (*p ≤ 0.05, ** p ≤ 0.01, *** p ≤ 0.001), n = 6 per group, data are represented as mean ± SEM
