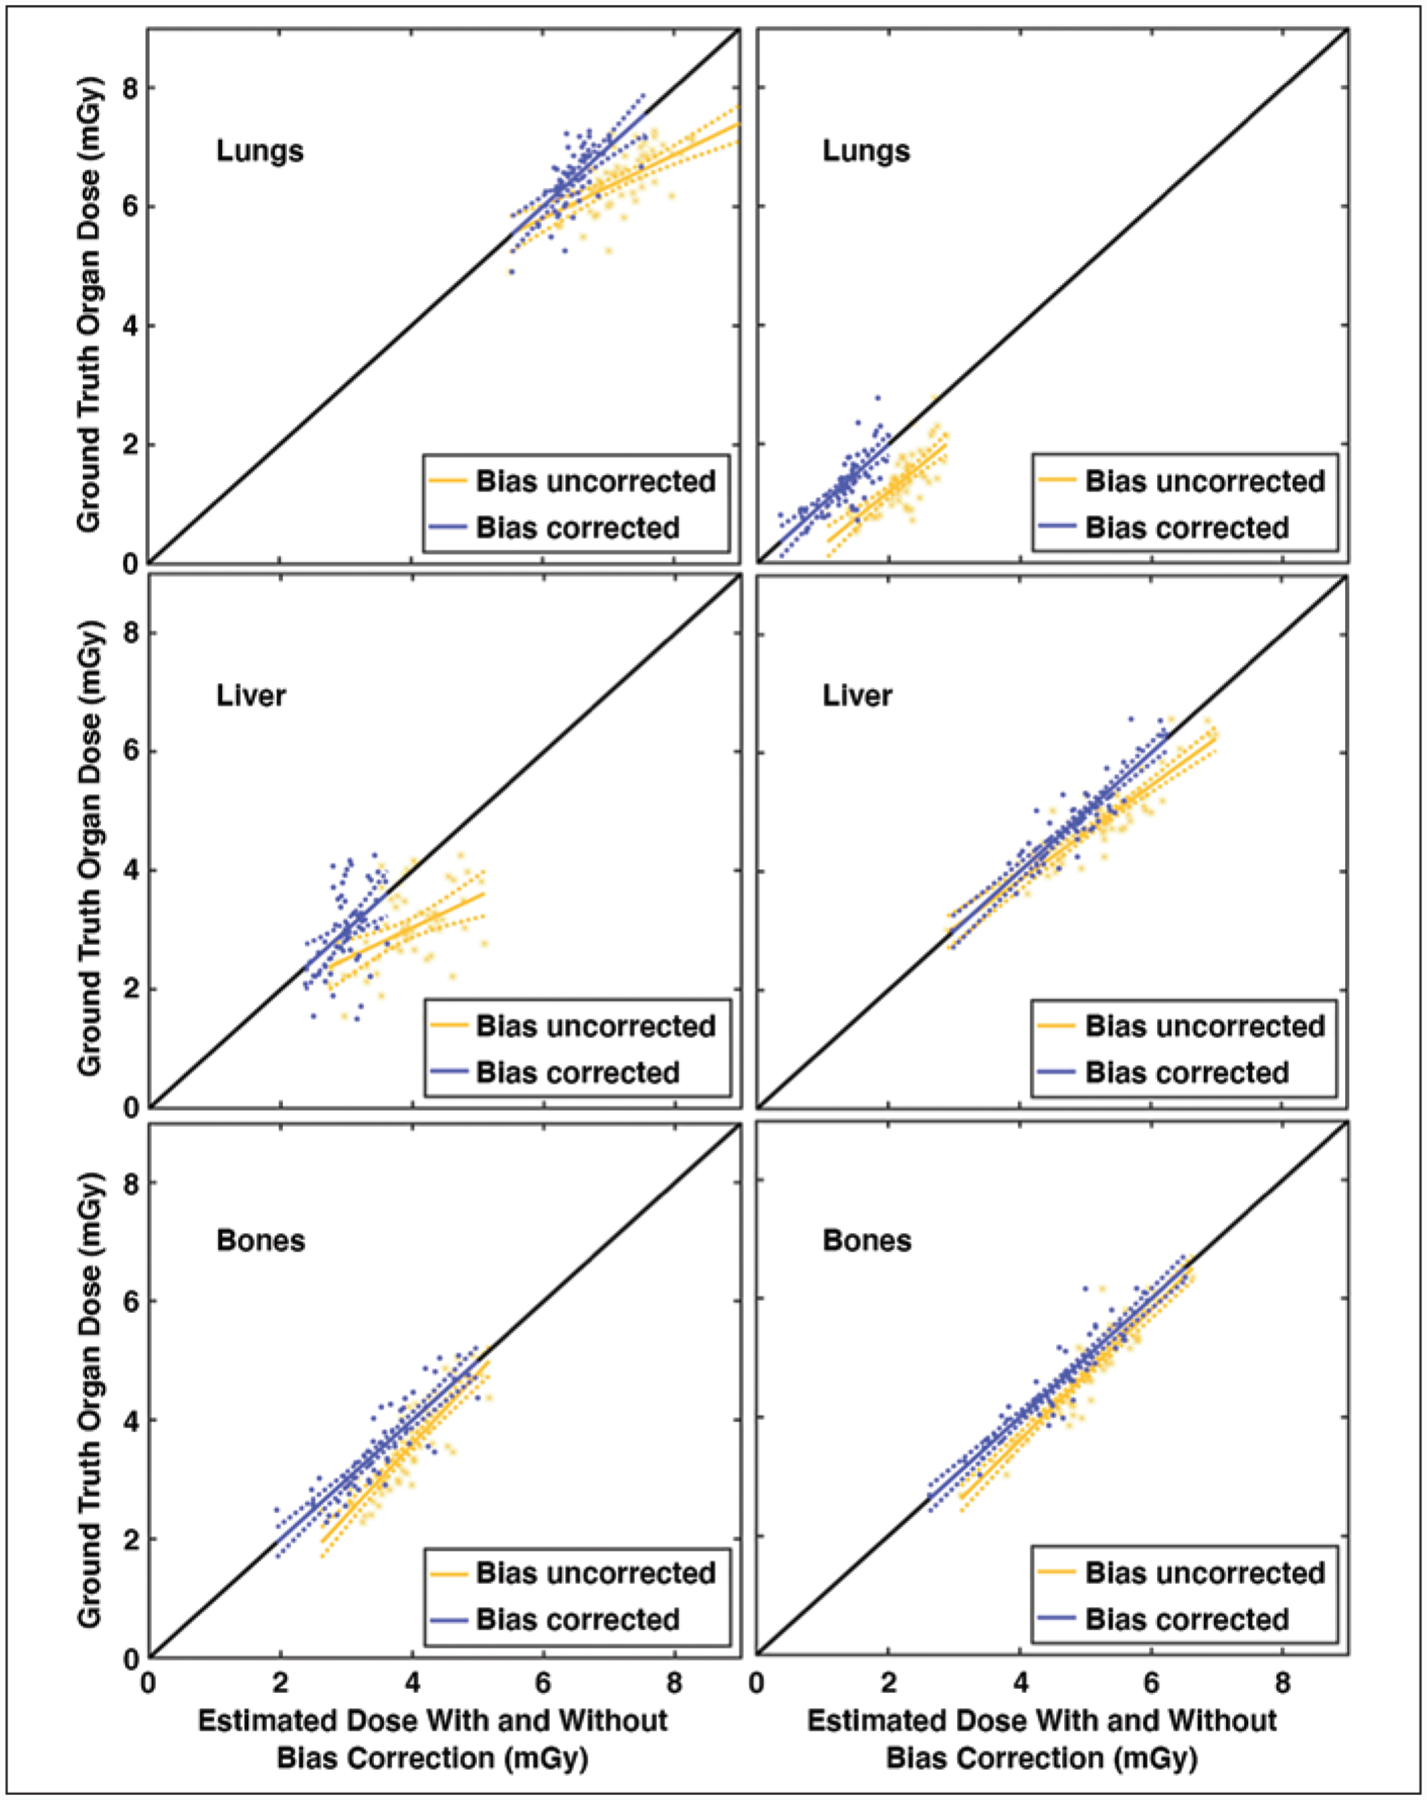
Fig. 3—

Linear models of ground truth (Monte Carlo simulation) organ dose (ODM) plotted against estimated dose (present study) without (ODC) and with (ODCD) bias correction for adult chest (left) and abdomen-pelvis (right) protocols. Each dot represents dose obtained from one phantom. Identity line is plotted in black; ideally all points lie on this diagonal line. Dashed lines represent CIs of linear model. Lungs (top), liver (middle), and bone surface (bottom) were chosen to represent organ on peripheral (inside), inside (on peripheral), or distributed for chest (abdomen-pelvis) protocols with respect to scan coverage.
