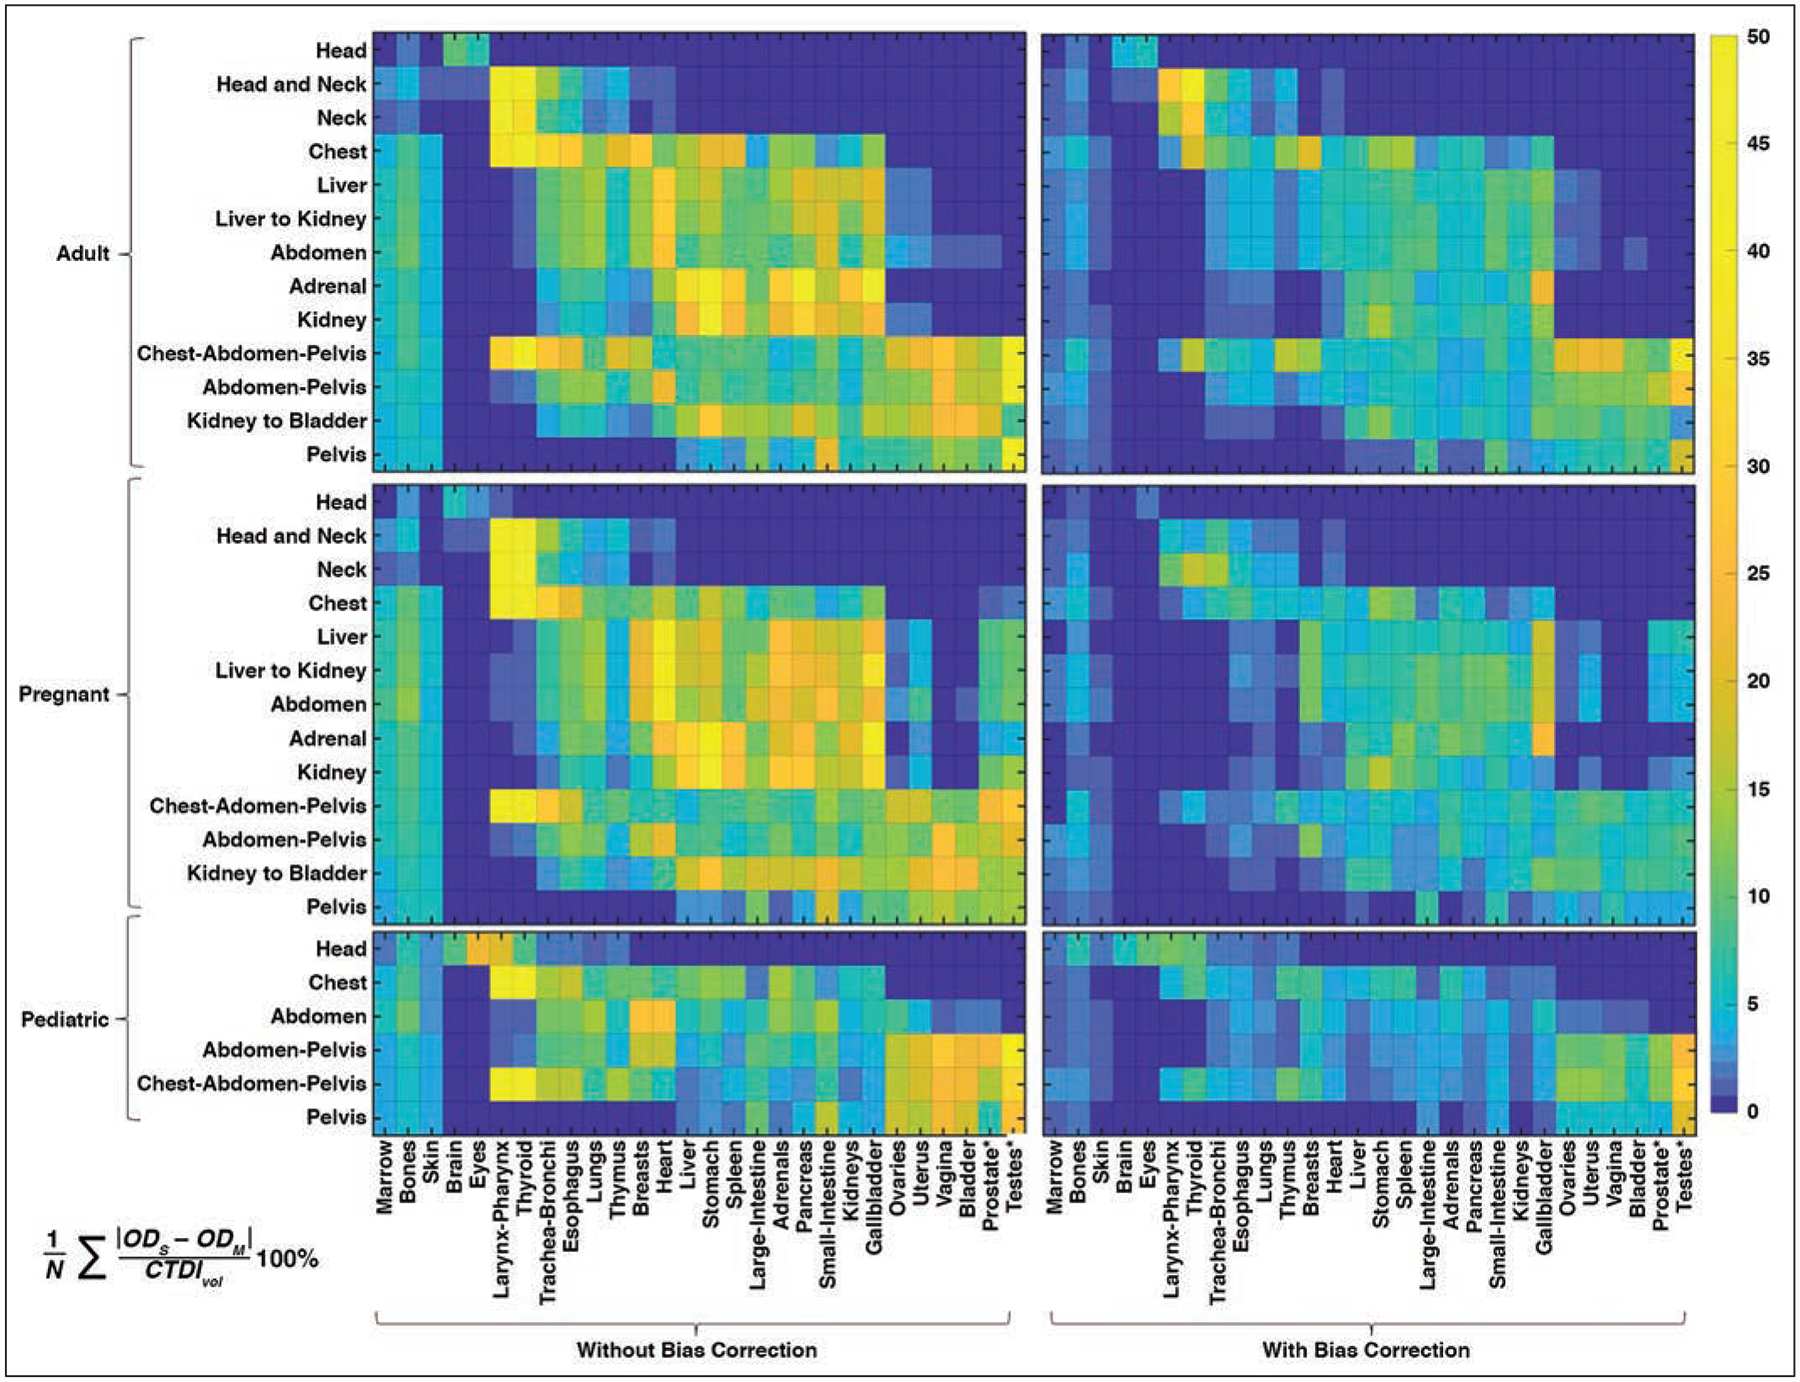
Fig. 4—

Maps of errors of organ dose estimation with and without bias correction, compared with ground truth (Monte Carlo) simulation averaged among phantoms in adult, pregnant, and pediatric cohorts for each organ protocol. Error was calculated as indicated in equation at bottom of figure, where N is number of phantoms, and ODS and ODM are organ dose estimated in this study and by Monte Carlo simulation, respectively. Asterisk represents fetus body and fetus bone tissue for pregnant cohort. Gradient scale indicates errors of organ dose estimation (%).
