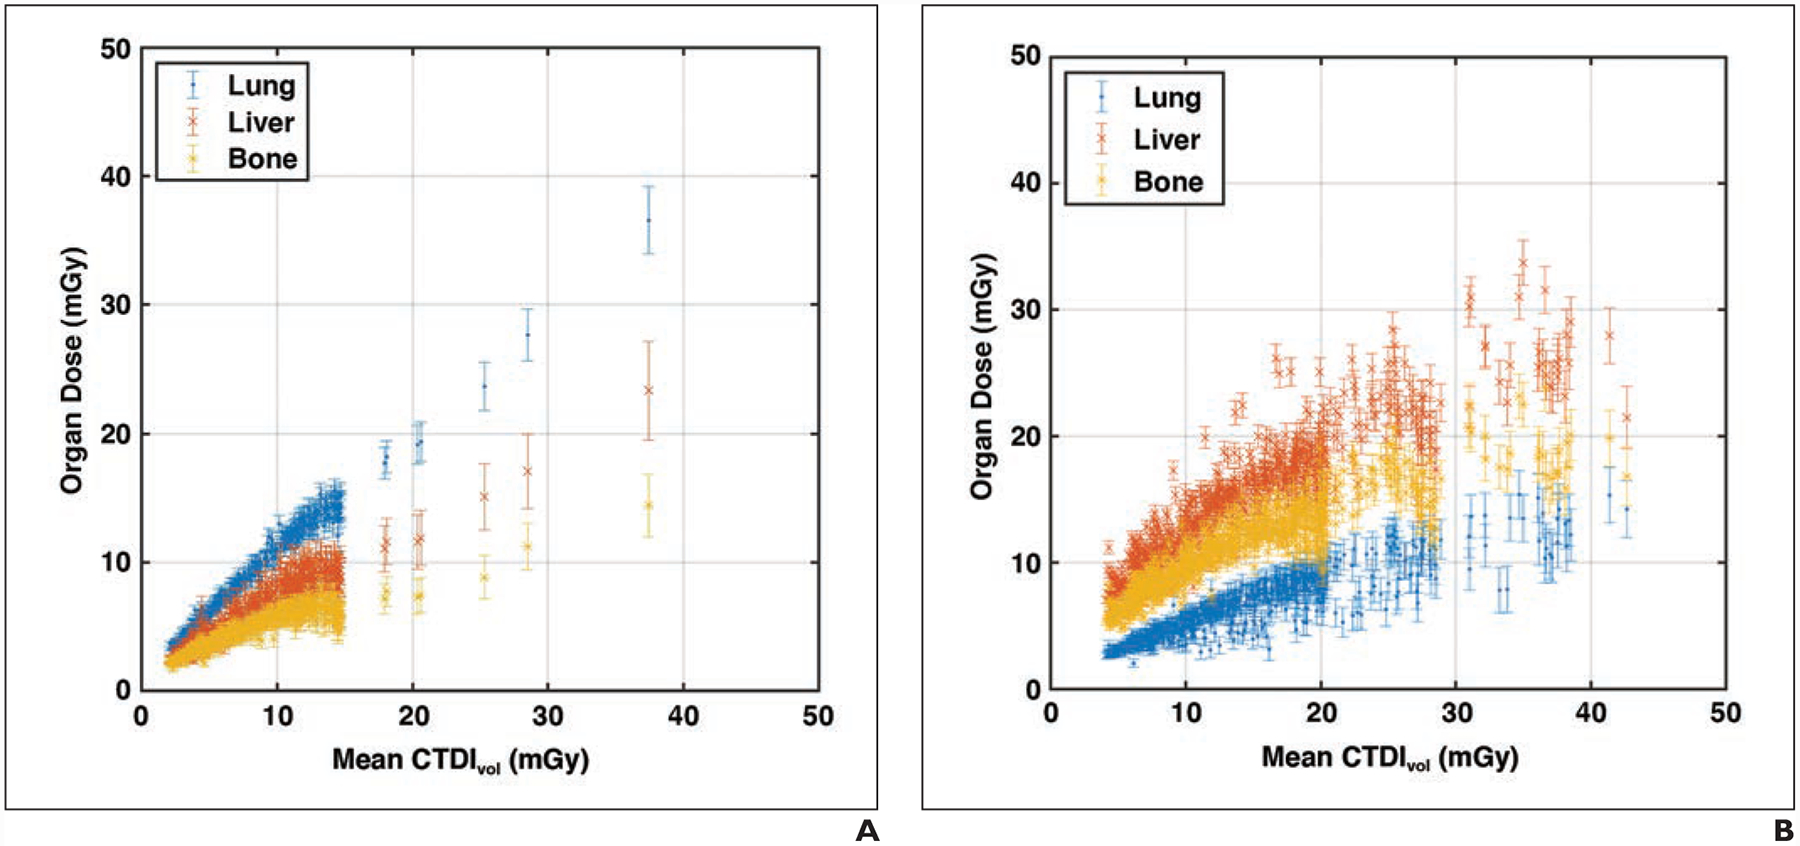
Fig. 5—

Organ doses plotted against volume CT dose index (CTDIvol). Error bars represent 95% CI.
A, Graph shows 401 chest examinations (mean age, 61 years; range, 18–88 years) including 170 women and 231 men.
B, Graph shows 647 abdomen–pelvis examinations (mean age, 56 years; range, 18–89 years) including 354 women and 293 men.
