
Figure 1.
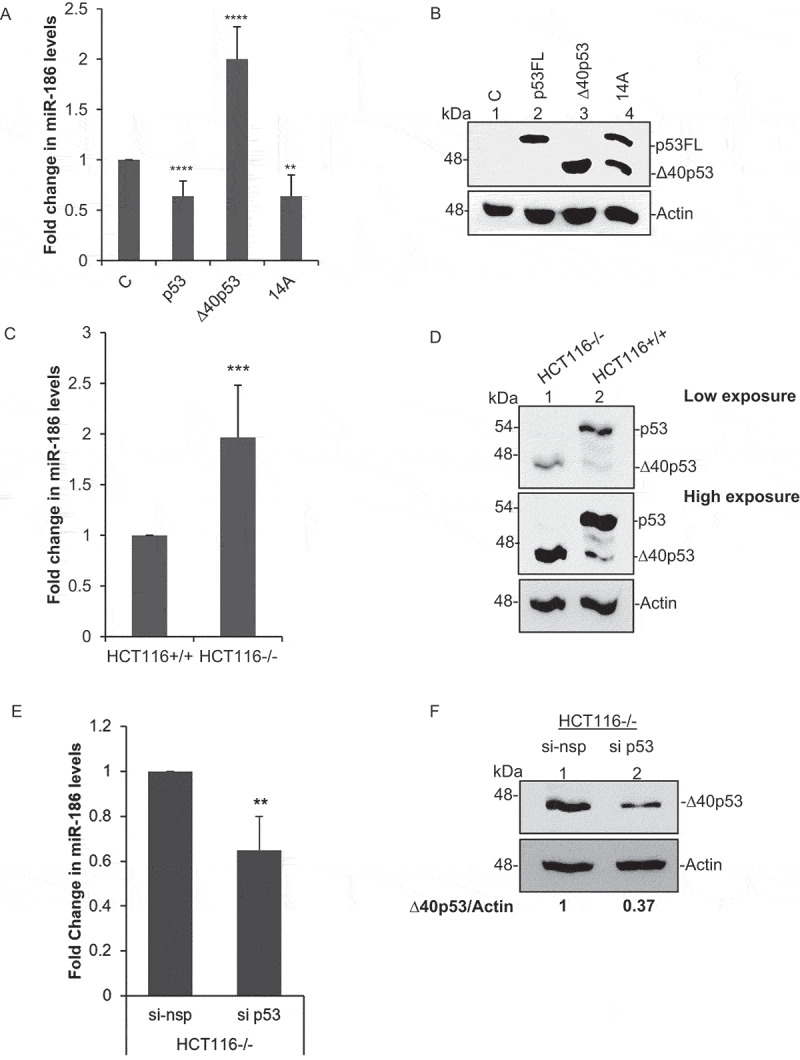
Upregulation of miR-186 under ∆40p53 expression
(A) Quantitative PCR for miR-186-5p (n = 3). (B) Western blot analysis of cell extracts from H1299 cells expressing control GFP (vector control), p53FL only, ∆40p53 only and 14A (expresses both p53FL and ∆40p53), probed with CM1 after 48 h. (C) Quantitative PCR using Taqman probe for validations of miR-186-5p in HCT116+/+ (expresses both p53FL and ∆40p53) and HCT116-/-cells (expresses only ∆40p53) (n = 3). (D) Western blot analysis of cell extracts from HCT116+/+ (expresses both p53FL and ∆40p53) and HCT116-/-cells (expresses only ∆40p53), probed with CM1. (E) Quantitative PCR using Taqman probe for validations of miR-186-5p in HCT116-/- (expresses only ∆40p53) cells transfected with either si p53(25 nM) or nonspecific si (si nsp) (n = 3). (F) Western blot analysis of cell extracts from HCT116-/- (expresses only ∆40p53) cells transfected with either si p53(25 nM) or nonspecific si (si nsp), probed with CM1.