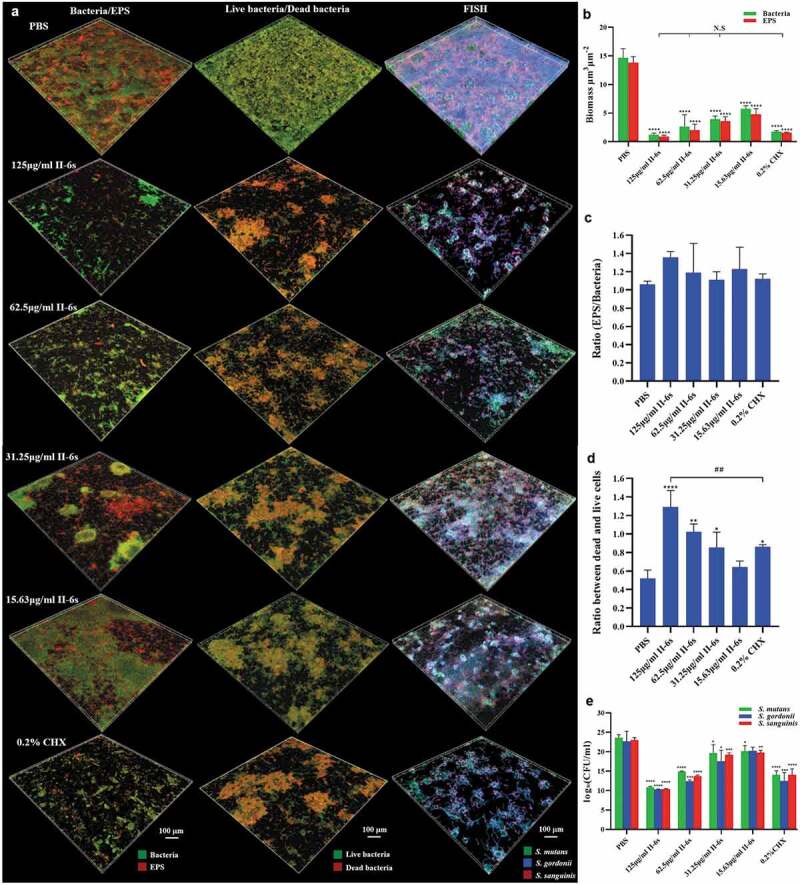
Figure 2.

Effect of II-6s on the microbial composition of mixed biofilms. (a) Representative images of bacteria/EPS staining, dead/live bacteria staining and fluorescent in situ hybridization (FISH) of 3-species biofilms. (b) The volume of EPS and bacteria within the biofilms. (c) The EPS/bacteria ratio within the biofilms. (d) Quantitative analysis of the dead/live bacteria ratio within the biofilms. (e) Quantitative analysis of the bacterial species composition based on quantitative PCR. Data are presented as means ± SD. *P < 0.05, **P < 0.01, ***P < 0.001, ****P < 0.0001 as compared to the PBS treated control. ##P < 0.01, as compared to the CHX-treated group. N.S., not significant
