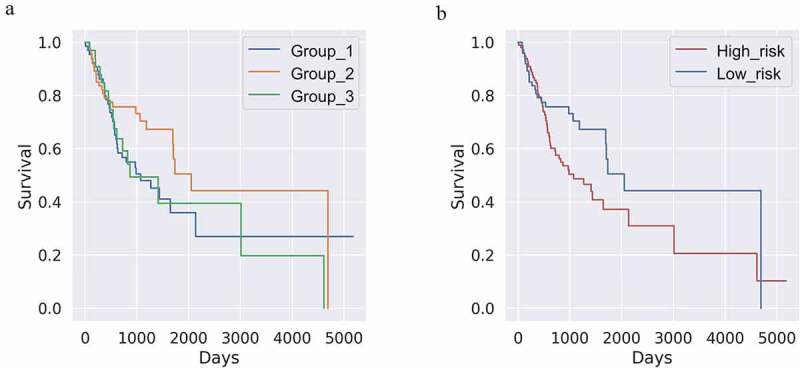
Figure 2.

(a) Kaplan‒Meier (k-m) plot of K-means clustering after cell-type identification by estimating relative subsets of RNA transcripts (k = 3 and n = 173). The yellow line (class 3) shows a distinct favorable survival pattern. (p-value = 0.26592) (b) K-M plot of Figure 2a regrouped by binary risk group. Groups corresponding to the blue and green lines in Figure 2a are merged into one high-risk group. (p-value = 0.01441)
