
Figure 1:
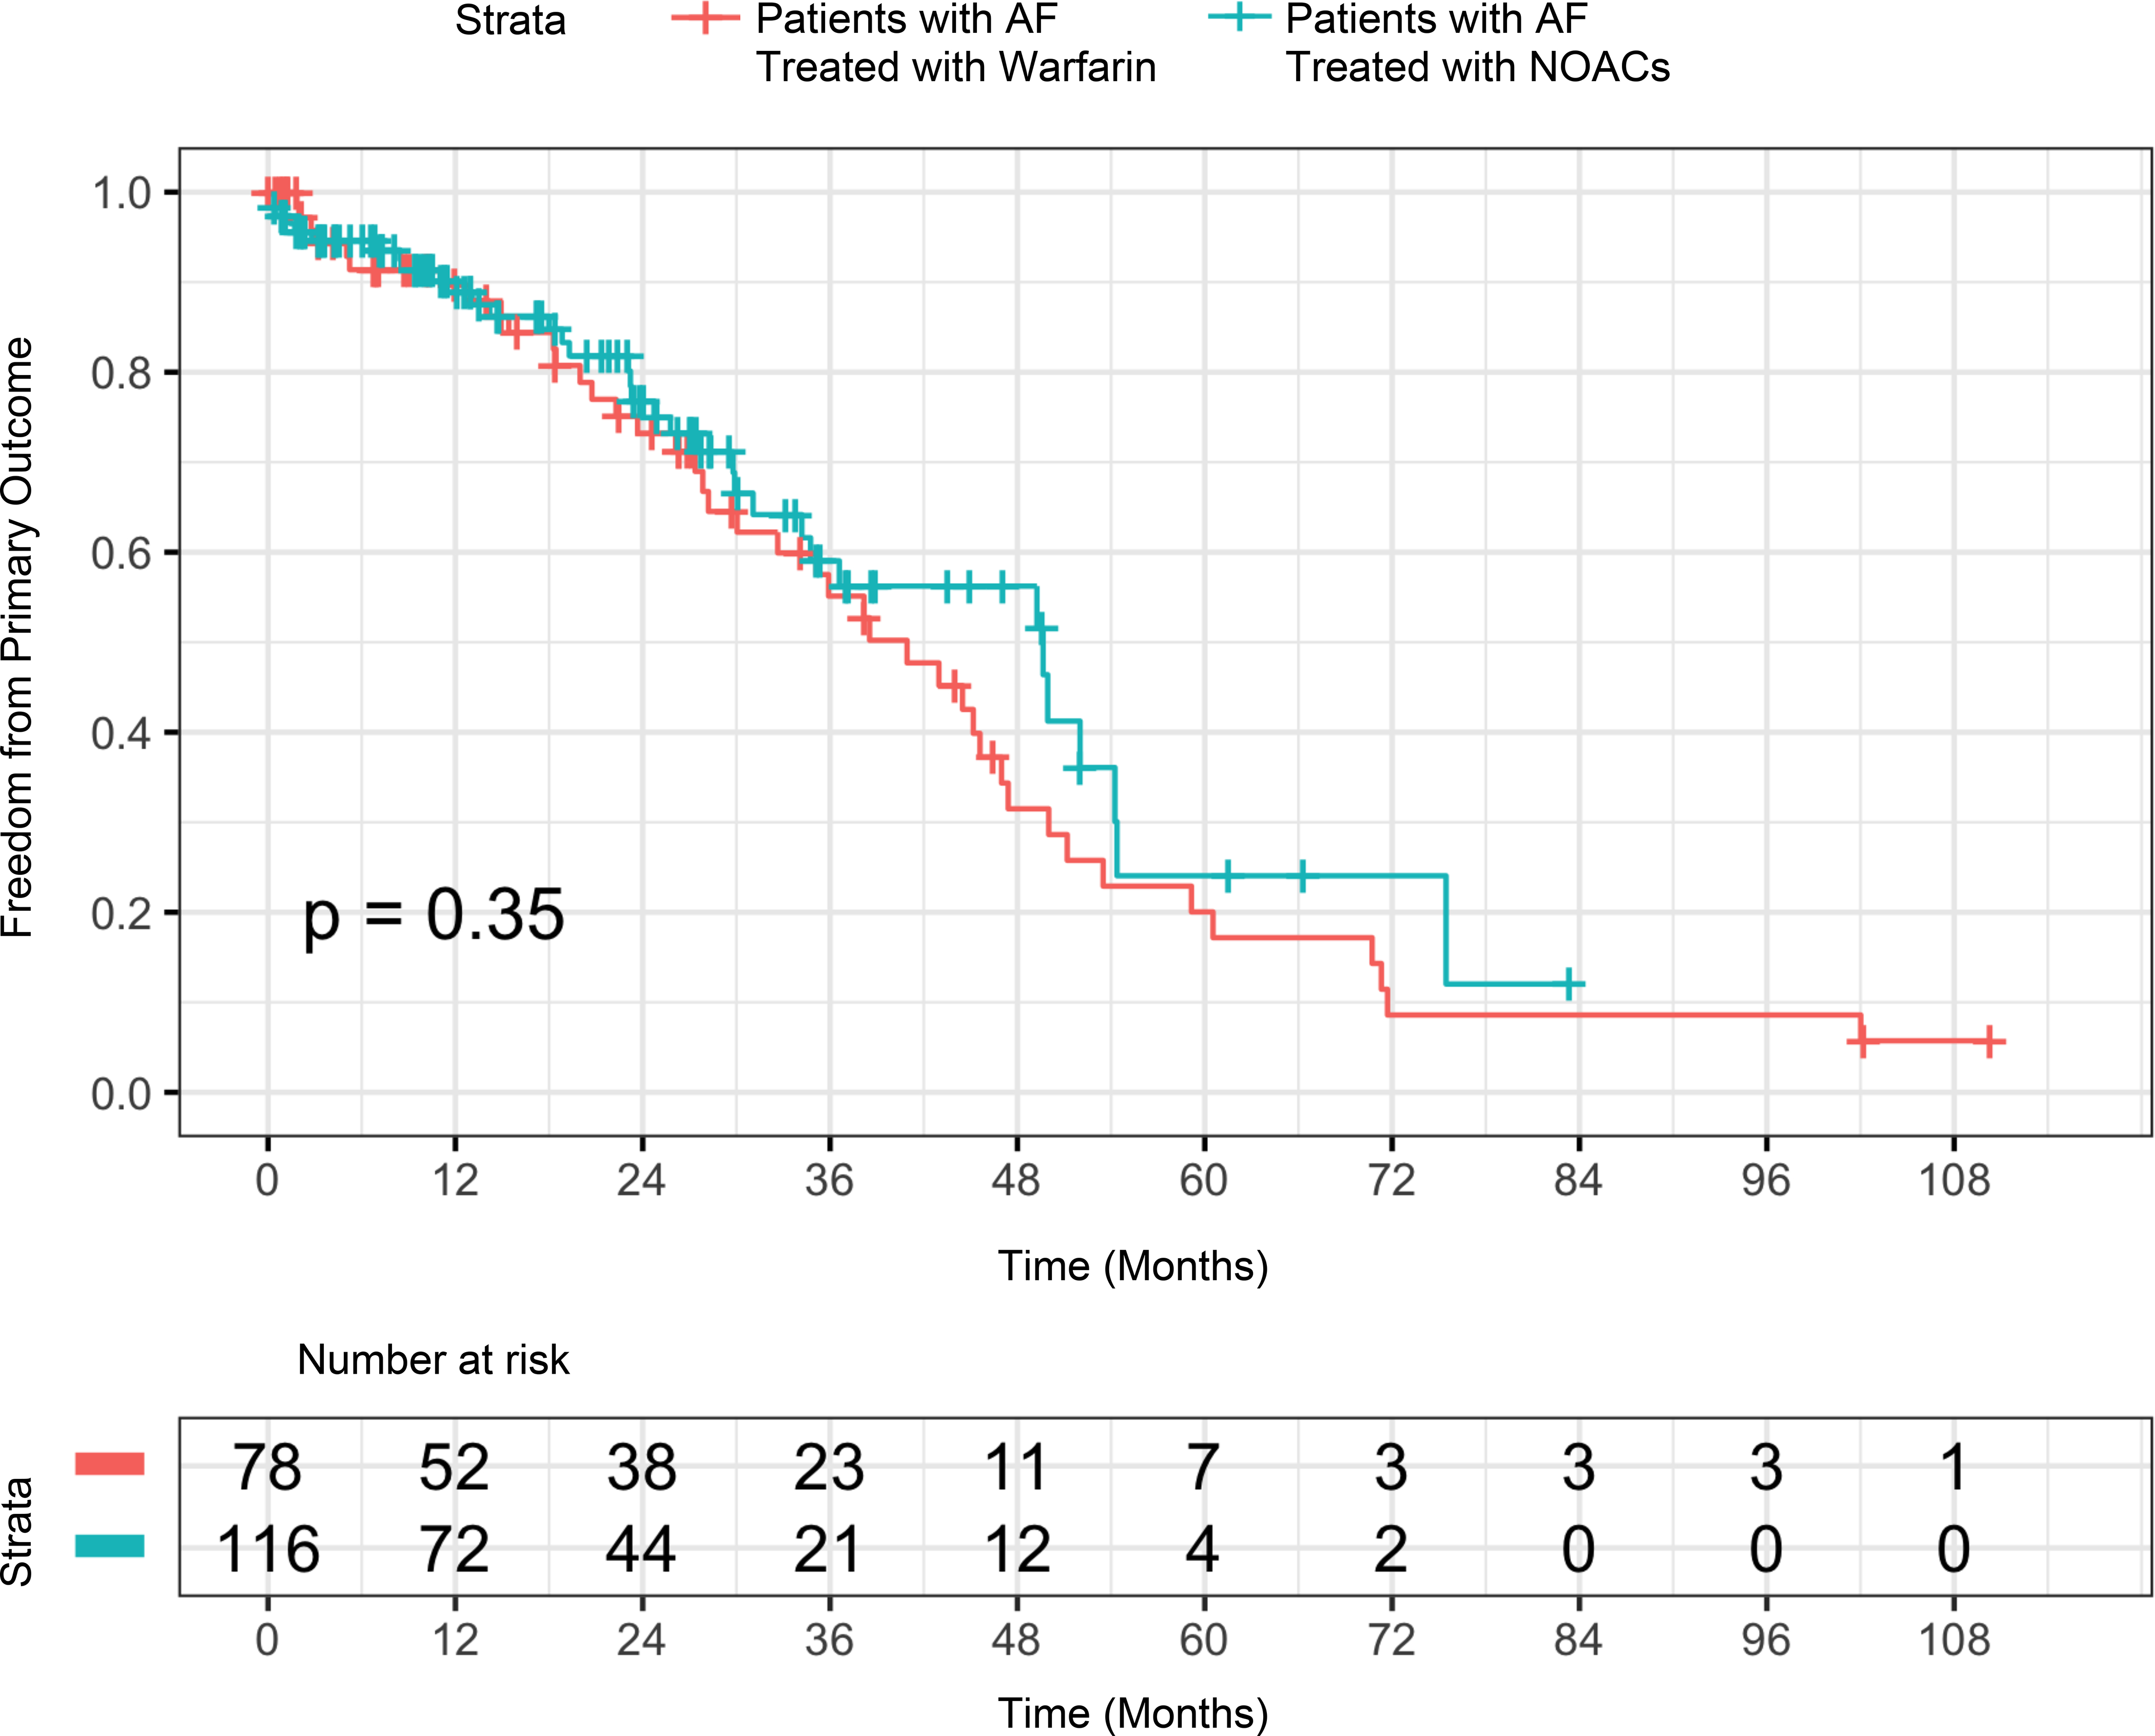
Time to event analysis of primary outcome including stroke, TIA, major bleed, or death in Patients with ATTR-CA and AF treated with warfarin compared with ATTR-CA and AF treated with NOACs. This Kaplan-Meier curve demonstrates the freedom from primary outcome comparing patients treated with warfarin with patients treated with NOACs (p=0.35).