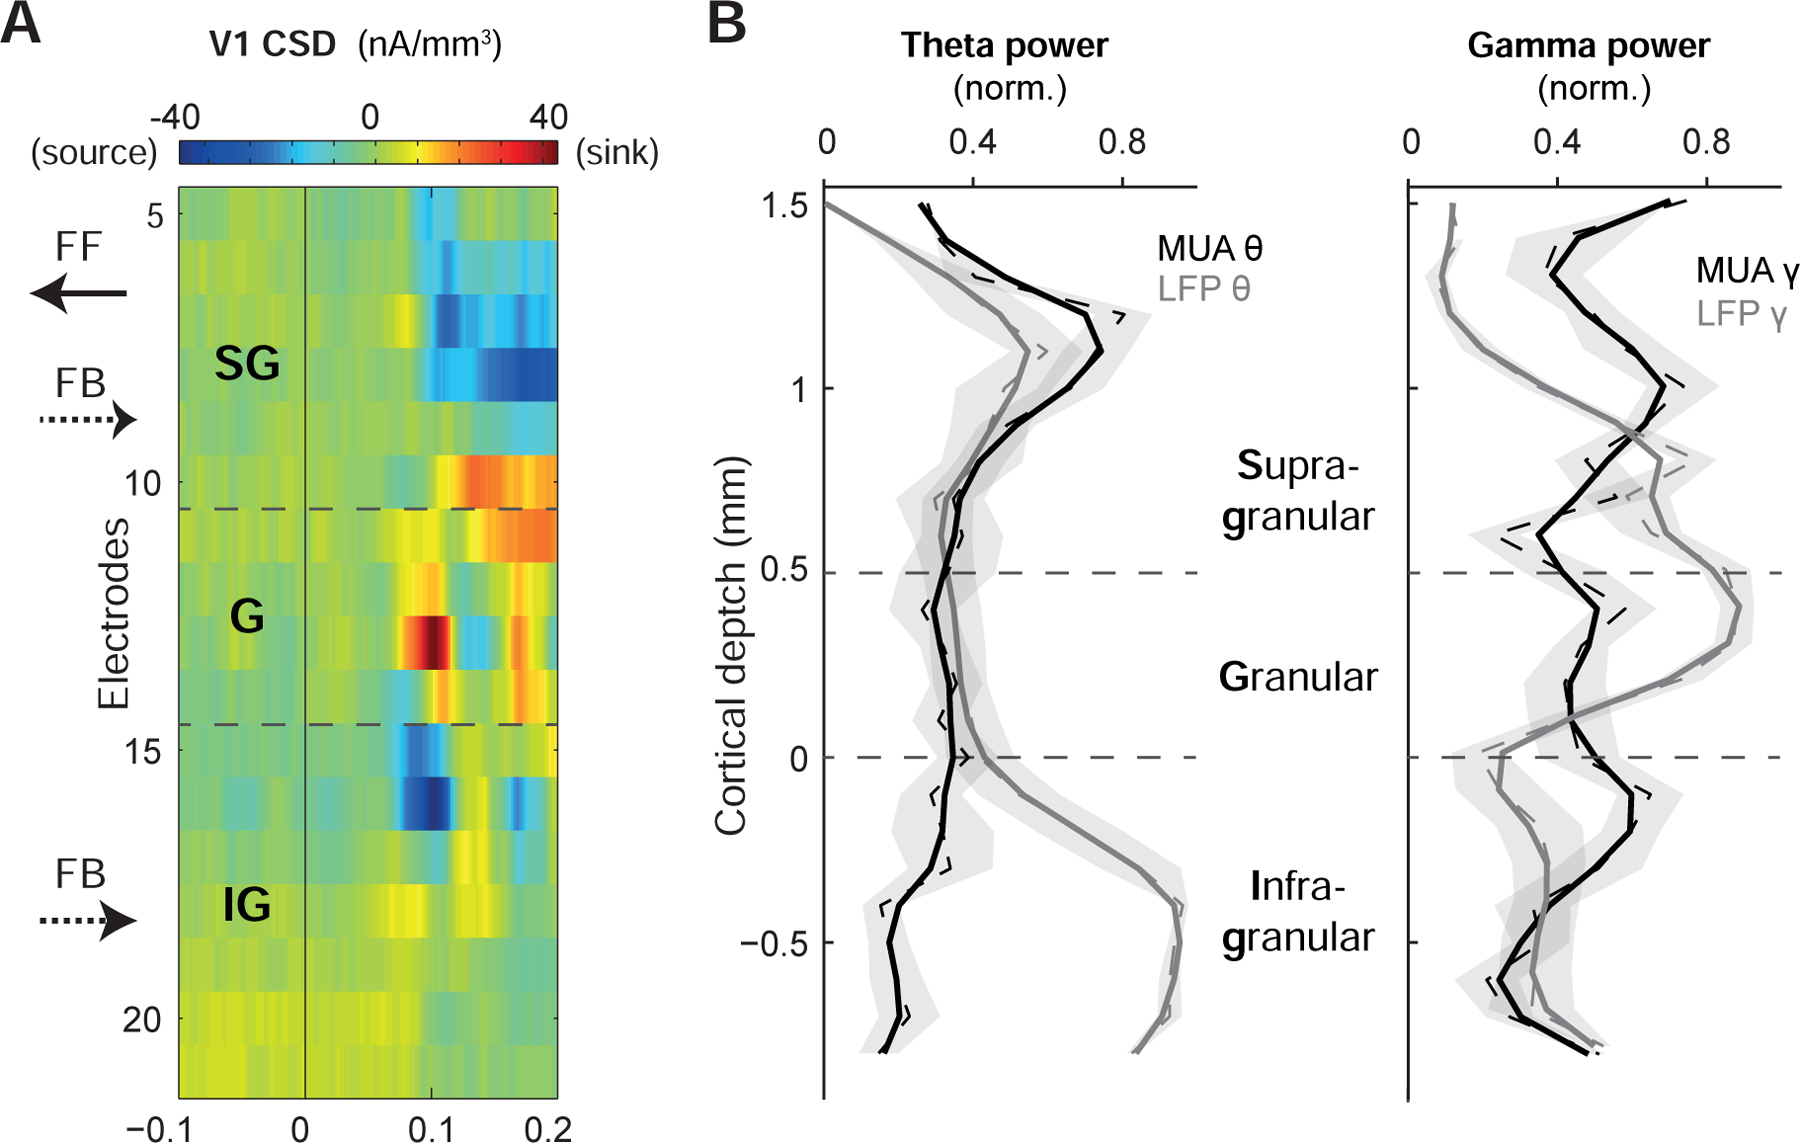
Figure 3. Laminar distribution of theta and gamma activity in V1.

(A) Current source density (CSD) based on the layer-resolved LFP of a linear multi-contact electrode for one example session representing the laminar profile of visually evoked responses in V1. FF: feedforward, FB: feedback to and from V4, SG: supragranular, IG: infragranular.
(B) Left panel: average and normalized V1 MUA (black) and LFP (gray) theta power (n = 9 sessions) as a function of cortical depth. Raw data is shown as dashed, smoothed data as solid lines, shaded areas depict SEM. Right panel: same as left panel, but for V1 MUA (black) and LFP (gray) gamma power.
