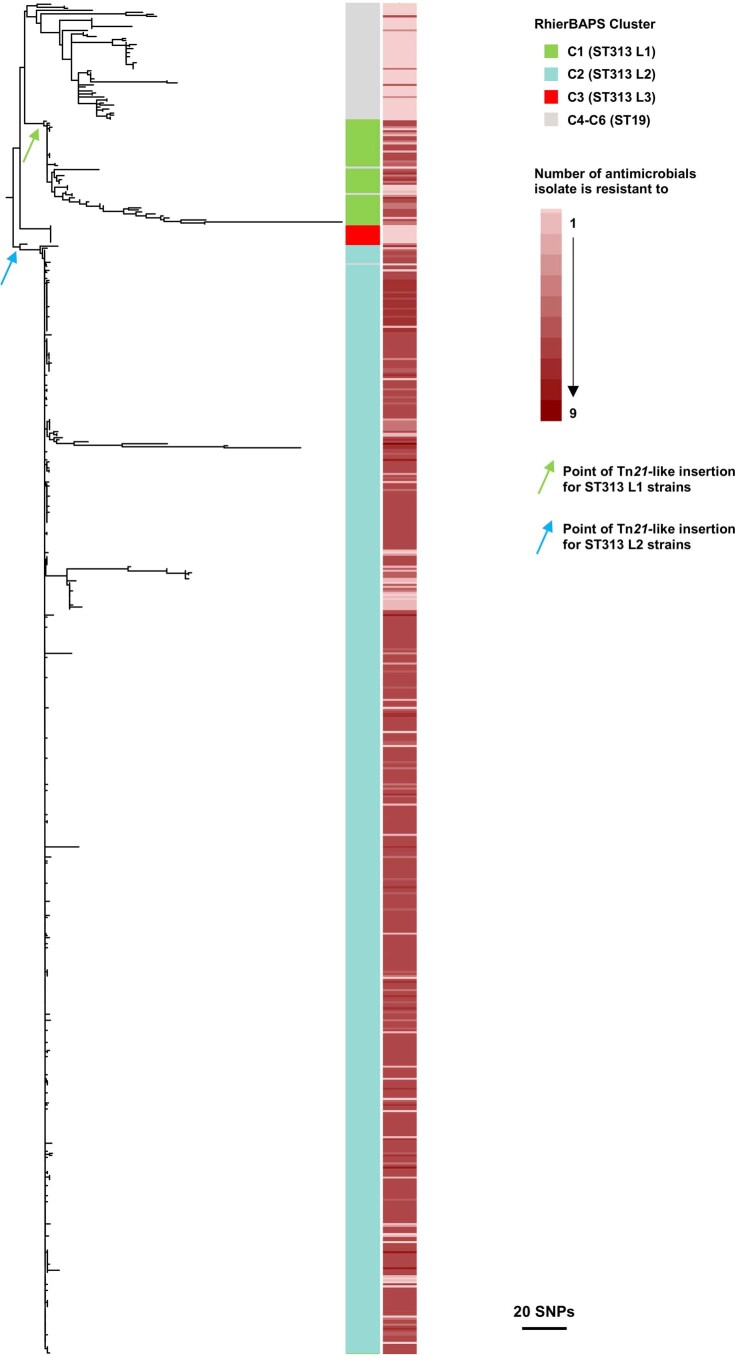
Extended Data Fig. 7. Phylogenetic reconstruction of pSLT plasmid.
Maximum likelihood phylogenetic tree showing the population structure of the pSLT plasmid in ST19 and ST313 lineages. Colour strip from right to left; cluster assignment of each isolate and number of antimicrobials each isolate is resistant to. The likely point of insertion of the Tn21-like element is indicated for ST313 L1 strains (green arrow) and ST313 L2 strains (blue arrow).

