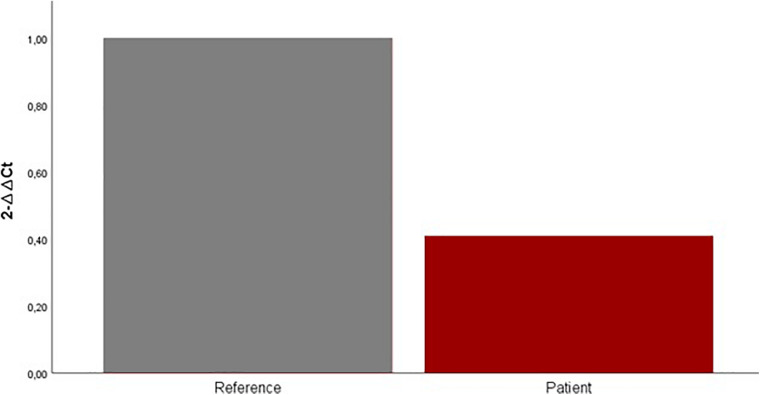
FIGURE 4.
Expression levels of CDK5RAP2 measured by qRT-PCR in the patient (red column) and set of reference samples (gray column). Each GAPDH-normalized mRNA level was further normalized against the corresponding mRNA level. Data are shown as fold change relative to the set of reference samples (defined as 1.0). Data are represented as mean ± SD.

