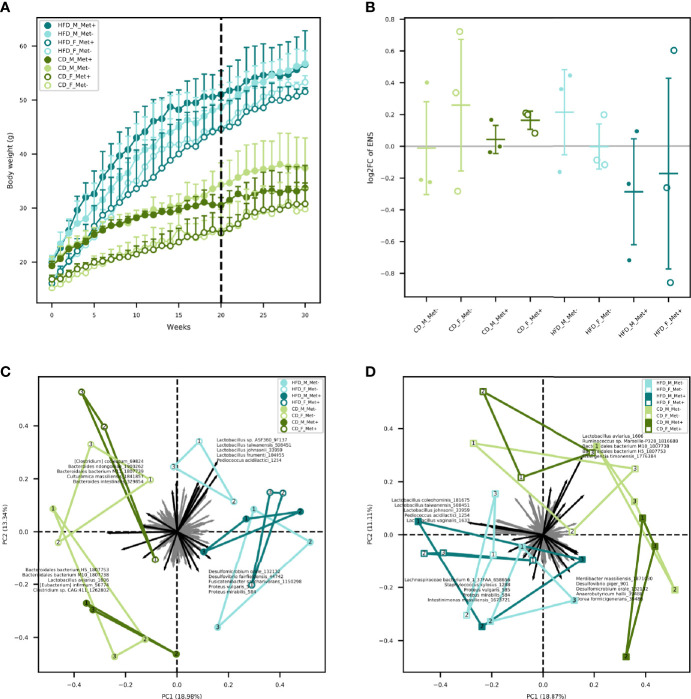
Figure 1.
Body weight and microbiome diversity analysis. (A) Mean body weight of each of the experimental groups in each of the weeks. Dashed line indicates the beginning of metformin treatment. (B) Changes in alpha diversity in each of the groups expressed as an effective number of species. (C) Beta diversity in each of the groups before the beginning of metformin treatment. (D) Beta diversity in each of the groups after 10 weeks long metformin treatment. Samples representing each experimental unit in each of the experimental groups are shown as dots.

