
Figure 2.
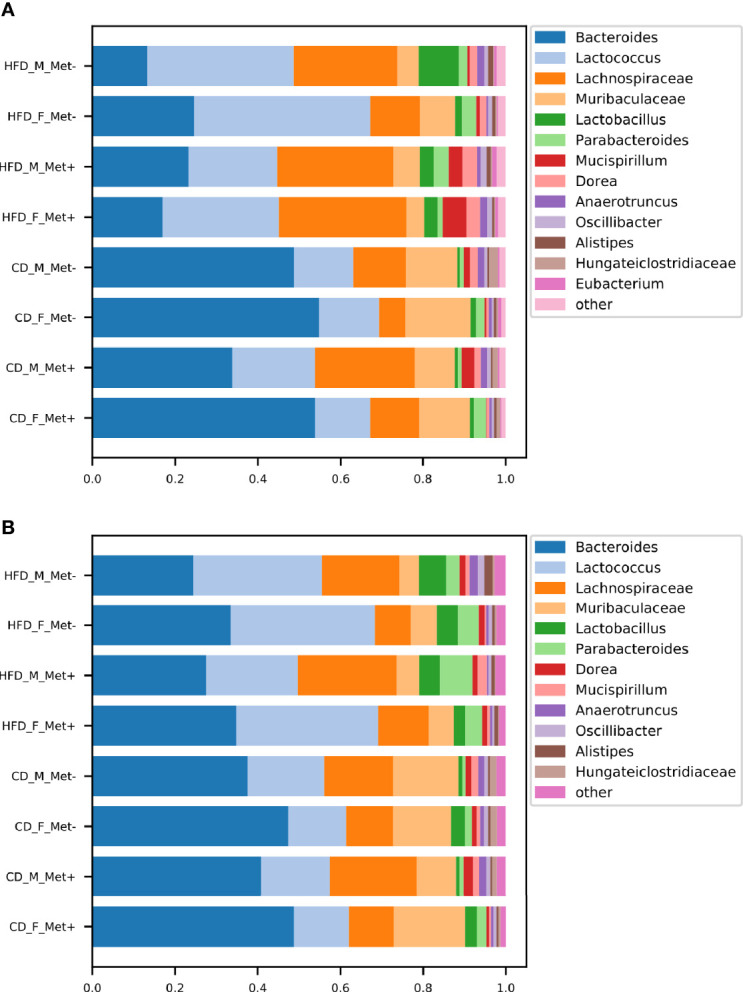
Microbiome composition at genus level in each of the experimental groups before and after the treatment. The abundances of top genera are expressed as proportions, only the genera or other lowest identified taxa with the relative proportion of at least 1% are shown. (A) time point before the treatment; (B) time point after the treatment.